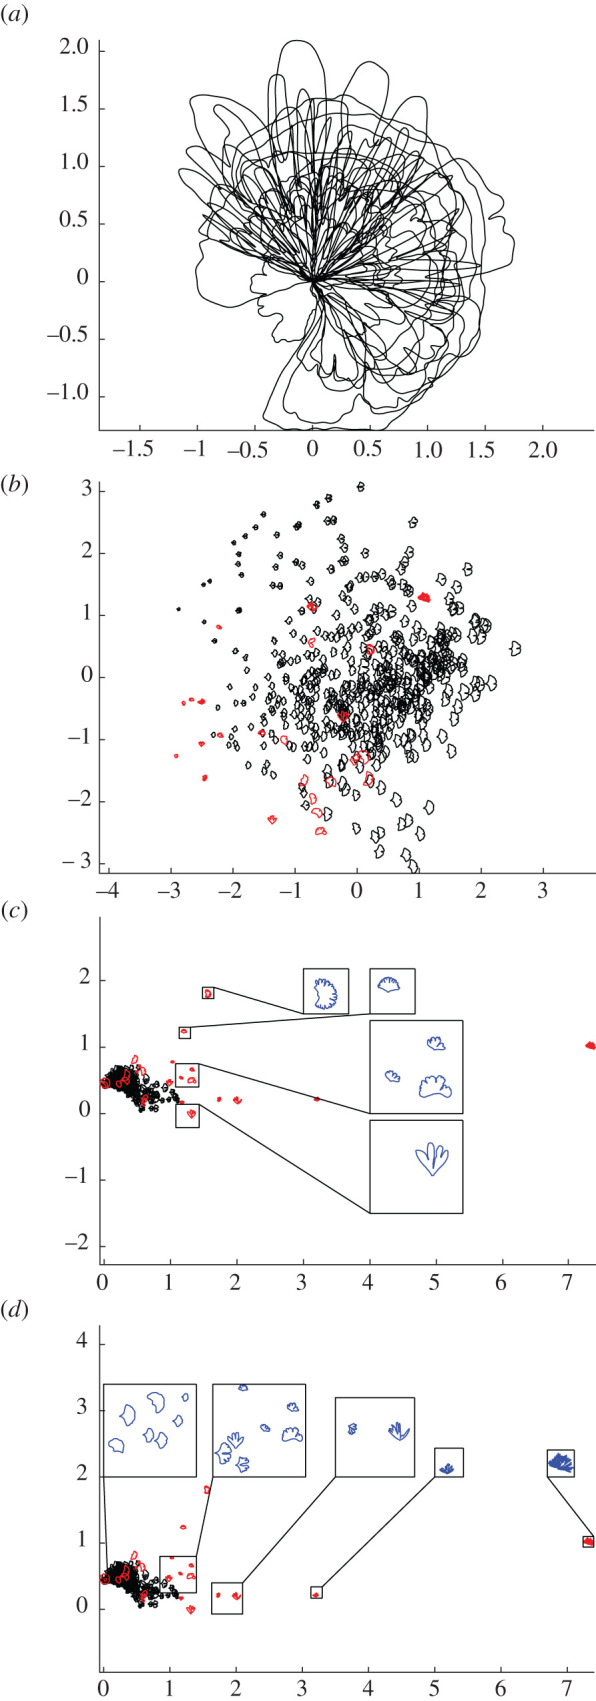
Figure 6.

Collection of 24 fossil Ginkgo leaves, each represented by their boundary curves (a). PCA ordination scatterplot (PC1 on horizontal axis, PC2 on vertical axis) showing morphological variation of modern Ginkgo leaves (black data points) together with fossil Ginkgo leaves (red data points) based on our geometric approach, the PCs together explain 64% of the variation (b). Ordination showing morphological variation of modern Ginkgo leaves together with fossil Ginkgo leaves based on our topological approach, with a vertical transect of enlarged leaves highlighted in blue (c) and a horizontal transect of enlarged leaves highlighted in blue (d). Modern leaves displayed with black data points and fossil leaves displayed with red data points (b–d).
