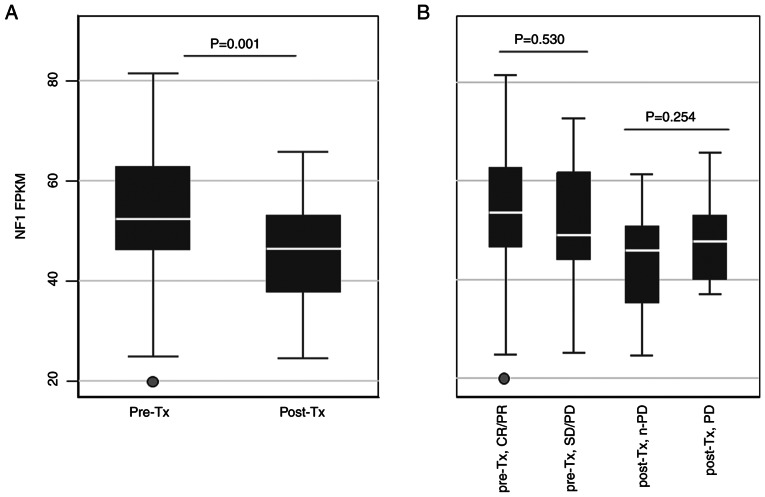
Figure 4.
NF1 FPKM values in cetuximab-treated tumor samples. NF1 FPKM values were displayed according to the cetuximab treatment status. (A) FPKM values after sorting by timepoint at which tumor samples were obtained. (B) FPKM values after sorting by combining the treatment response and time points at which tumor samples were obtained. NF1, neurofibromin; FPKM, fragments per kilobase of transcript per million; Tx, treatment; CR, complete response; PR, partial response; SD, stable disease; PD, progressive disease.

