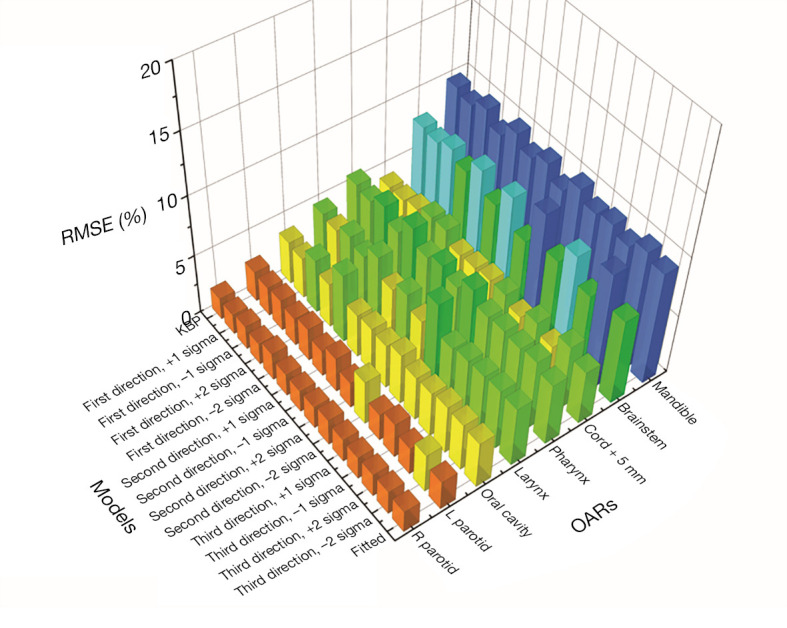
Figure 6.

RMSE values for model predicted DVHs measured against corresponding TPS plan DVHs. Small RMSE values indicate that hyperplane predicted DVHs closely resemble the realized DVHs of auto-generated plans and hence provide evidence that the hyperplane DVH predictions are highly achievable. Different colors denote different ranges of RMSE values. RMSE, root-mean-squared error; DVH, dose-volume histogram; TPS, treatment planning system.
