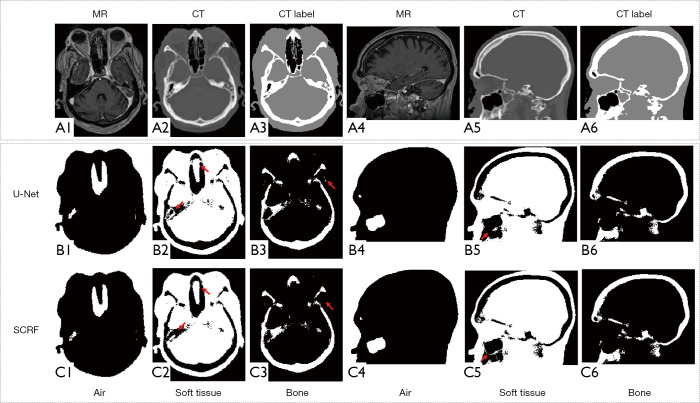
Figure 7.
Qualitative comparison between U-Net and SCRF methods. (A1) and (A4) shows MRI in axial view and sagittal view, respectively. (A2), (A5) and (A3), (A6) are corresponding CT images and CT labels (black for air, gray for soft-tissue, white for bone) respectively. Row (B) and (C) are results generated with RF and SCRF respectively. The red arrows indicate soft tissue and bone regions that are challenging during classification. MRI, magnetic resonance image; SCRF, semantic classification random forest.

