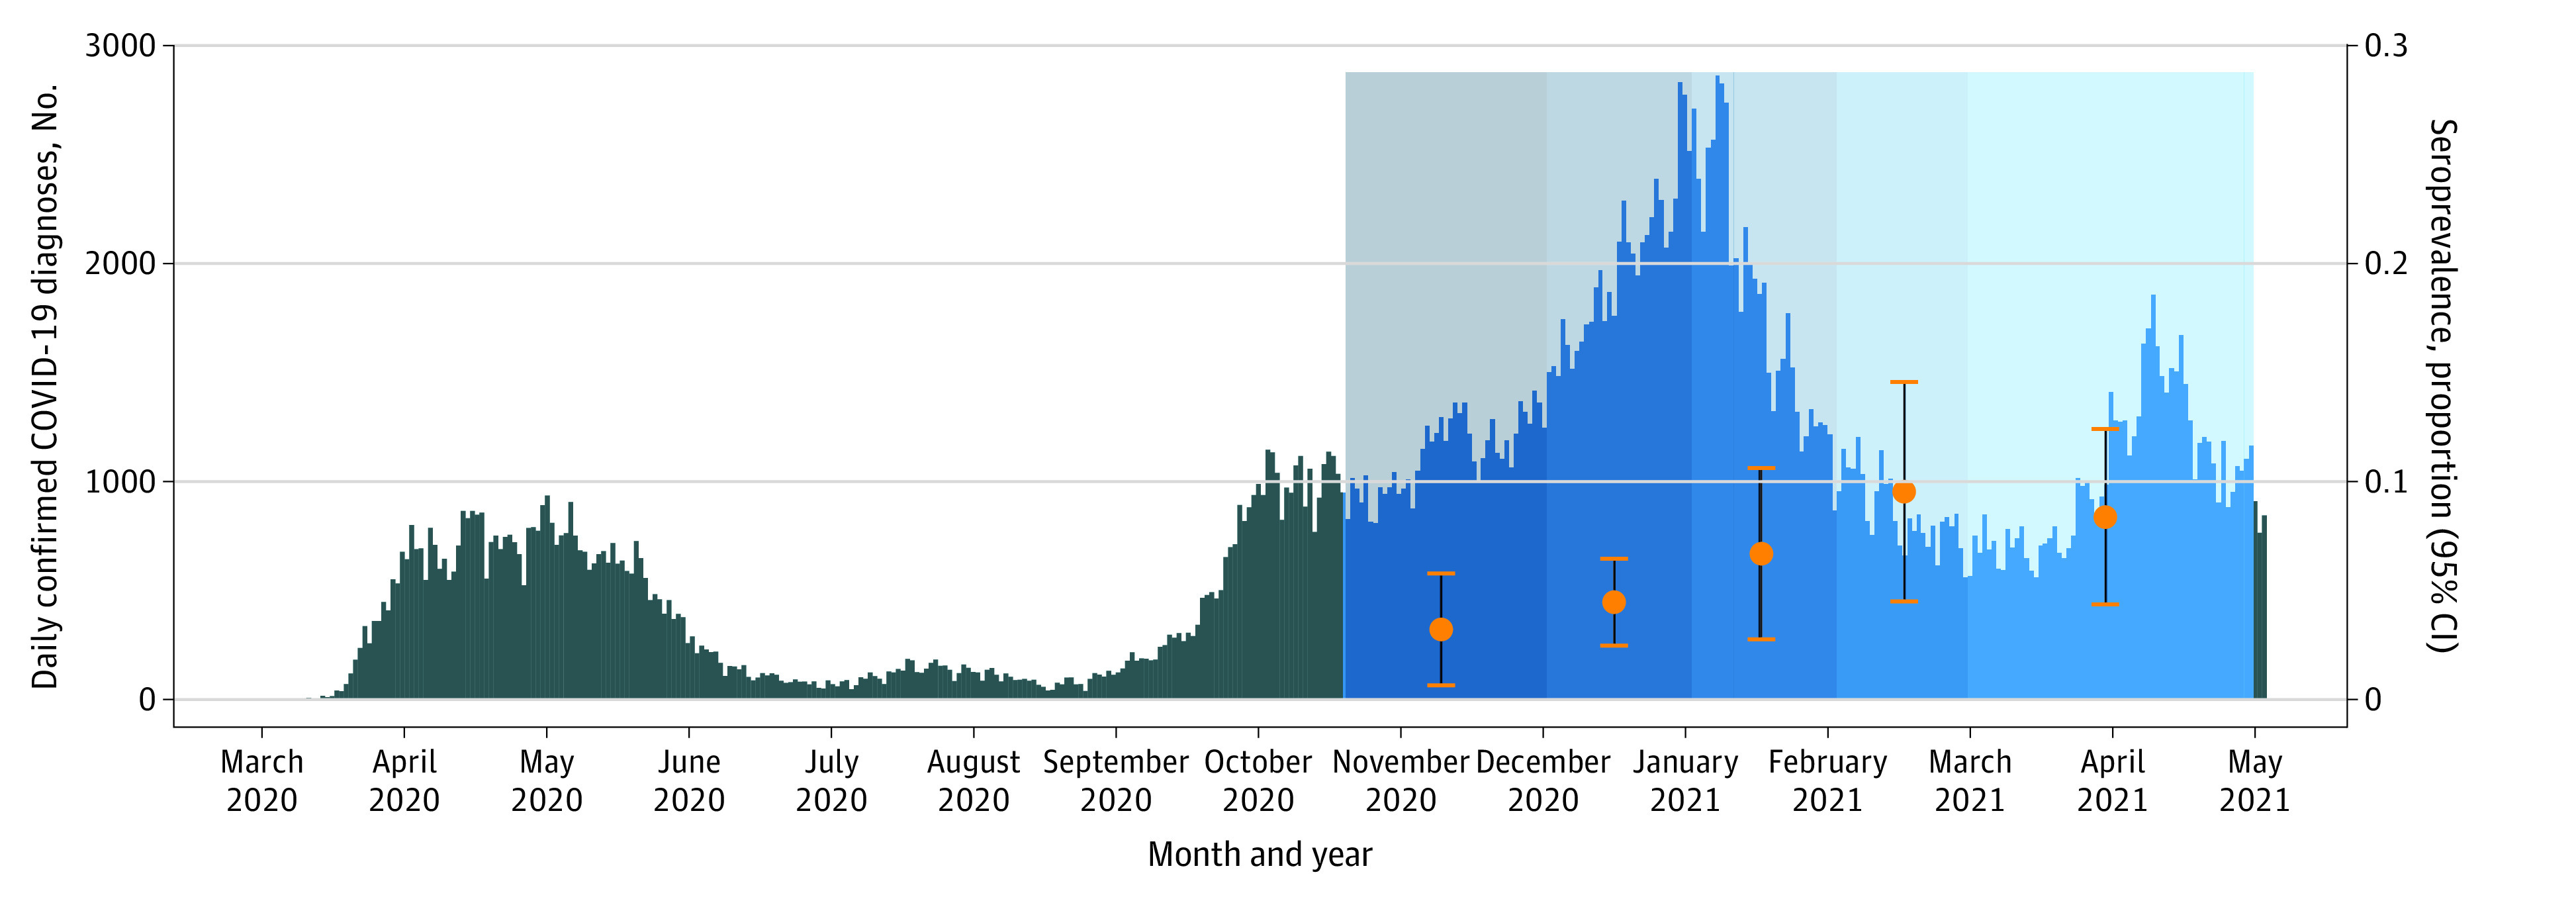
Figure 2. Estimated Seroprevalence for Participants Compared With Overall Daily Confirmed COVID-19 Cases in Quebec.

The dots and whiskers indicate seroprevalence estimates and 95% CIs for the study population for different months during the first wave of data collection. The shaded area marks the study period, with the gradient indicating different months.
