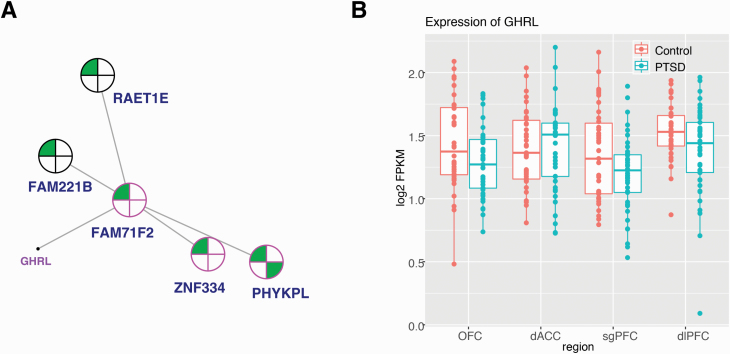
Figure 2.
Network coexpression analysis across prefrontal cortex regions revealed the posttraumatic stress disorder (PTSD)-associated lightcyan module, enriched for differentially expressed genes (female) and containing ghrelin (GHRL). (A) A 2-dimensional representation of the local gene network surrounding GHRL is depicted (full organization of the module presented in supplementary Figure 3). Nearest key drivers are outlined in pink and nodes are outlined in black. Colors inside the circles signify regulation of gene expression (green = downregulation) in brain regions as represented by numbers: in the dorsal anterior cingulate (dACC), dorsolateral PFC (dlPFC), orbitofrontal cortex (OFC), and subgenual PFC (sgPFC). (B) Box plot displays the expression level (fragments per kilobase of exon model per million reads mapped [FPKM]) of GHRL in individuals with PTSD vs neurotypical comparison subjects in the dACC, dlPFC, OFC, and sgPFC. Individual sample FPKMs are indicated and error bars indicate ± SEM.

