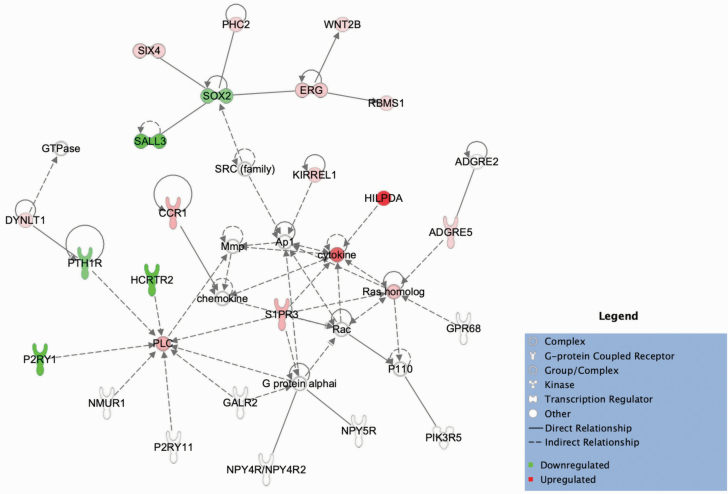
Figure 5.
Hypocretin receptor type 2 (HCRTR2) was a differentially expressed gene in the posttraumatic stress disorder with normal vs high body mass index (PNH) comparison among male subjects and was determined to form a network with other genes differentially expressed in the dataset involved in inflammation as well as with members of the NPY signaling pathway: receptor Y4 (NPY4R/NPY4R2) and receptor Y5 (NPY5R). Ingenuity Pathway Analysis software was used to generate a spatial representation of this inferred network, formed surrounding “seed” molecules in the dataset that are highly interconnected based on known biological relationships and including other molecules known to interact. Shapes represent the type of molecule. Colors inside the shapes signify regulation of gene expression (red = upregulation; green = downregulation). Solid line signifies a direct relationship; dotted line signifies an indirect relationship. dACC, dorsal anterior cingulate; dlPFC, dorsolateral PFC; OFC, orbitofrontal cortex; sgPFC, subgenual PFC.

