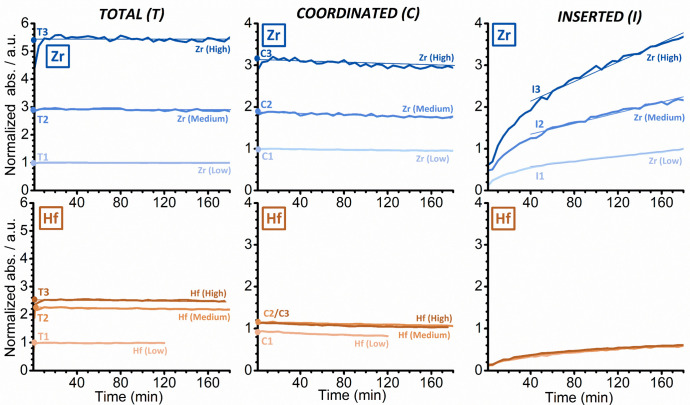
Figure 7.
Evolution of the intensities of the FT-IR absorption bands T (total amount of d-ACN), C (coordinated d-ACN), and I (inserted d-ACN) as a function of time, which were derived from a series of experiments in which SiO2/MAO/Zr (top) and SiO2/MAO/Hf (bottom) were treated with d-ACN at three different concentrations (high, medium, and low). The data were normalized to the optical thickness of the pellets and rescaled with respect to the Zr (Low) experiment for comparison.

