
Figure 1.
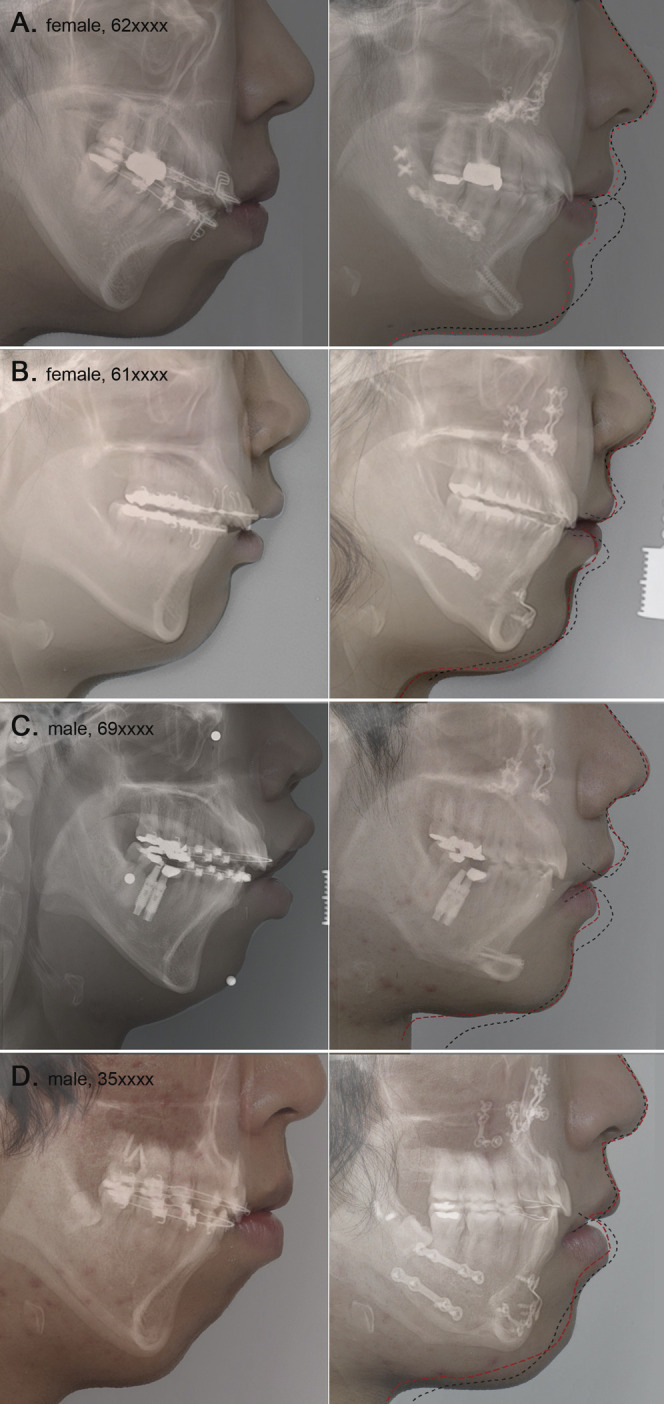
A graphic comparison of real cases showing original profiles on the left-hand side and actual postoperative profiles on the right-hand side. In this study, accuracy of the actual resulting soft tissue response is considered to be the measure of prediction quality. Black dashed lines indicate the profile predicted using commercial software that applies a conventional prediction algorithm. Red dotted lines superimpose the predicted profile produced by our prediction method. Although discrepancies between predictions and actual treatment outcomes were evident, the results using our method had a better prediction quality. The red lines seem to have a more natural curvature and a more accurate prediction than the black lines that were produced by the commercial software. In cases of preoperative strained lower lip, lip incompetency, and adjunctive genioplasty, our method showed a significant improvement over the conventional method.