FIGURE 6.

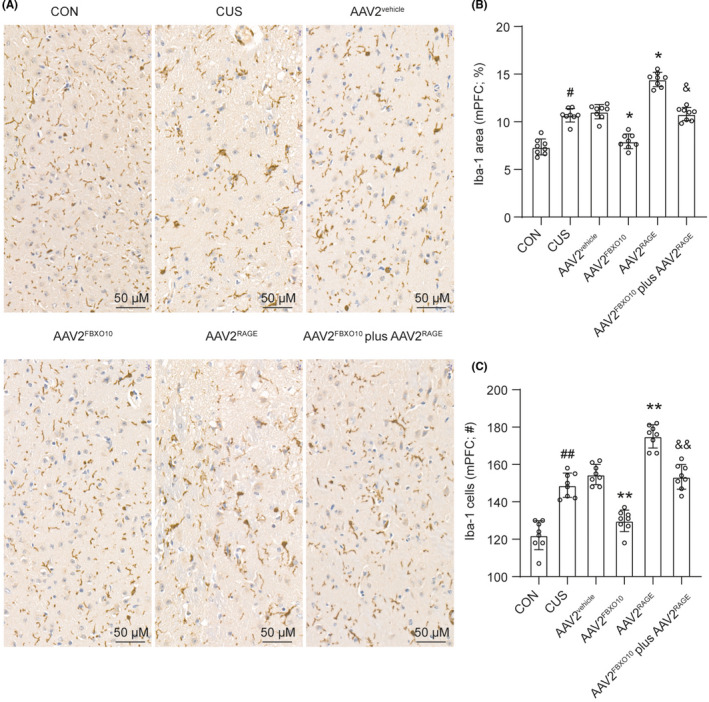
FBXO10/RAGE axis regulates morphological alterations in microglia in the medial PFC after CUS exposure. Male wild‐type mice received bilateral infusion of AAV2vehicle, AAV2FBXO10, AAV2RAGE, or AAV2FBXO10 plus AAV2RAGE and were subjected to 14 days of CUS. Three hours after the final stressor, mice were perfused and brains collected for immunohistology. (A) Representative images of Iba‐1 immunohistochemistry in the medial PFC were shown. Scale bar represents 20 μm. (B) Quantification of Iba‐1 proportional (%) area in the medial PFC (n = 8 per group). (C) Number of Iba‐1 microglia per field in the medial PFC (n = 3 per group). Bars represent the mean ±SEM. #P < 0.05, ##P < 0.01 vs. control mice; *P < 0.05, **P < 0.01 vs. AAV2vehicle; &P < 0.05, &&P < 0.01 vs. AAV2FBXO10
