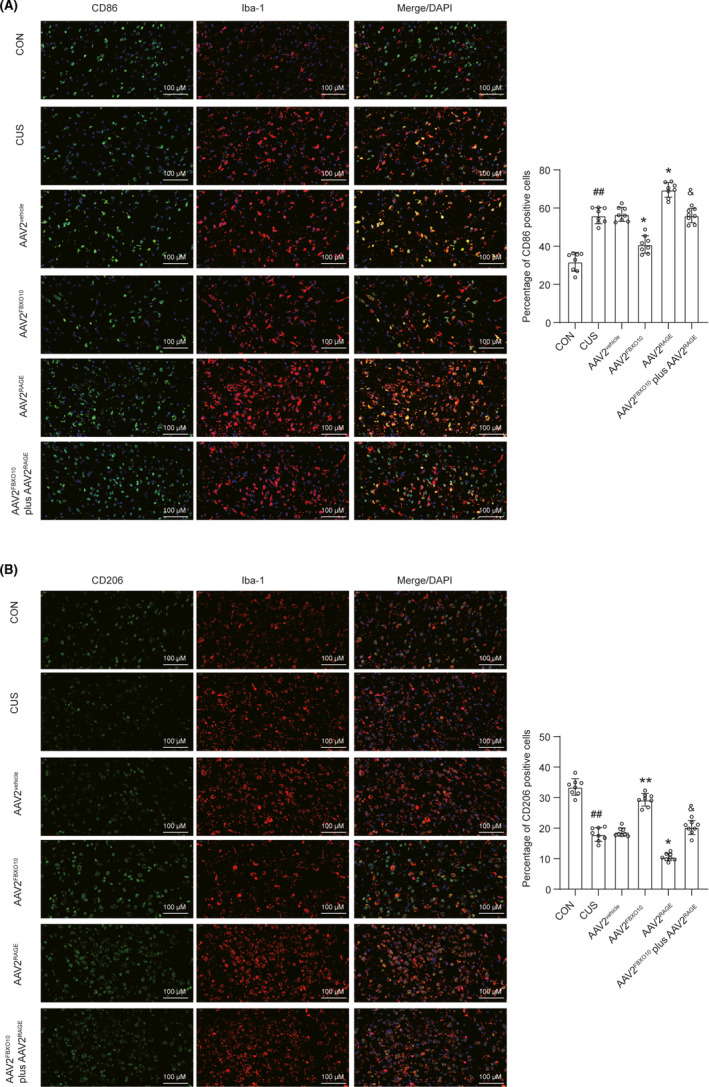
FIGURE 7.

Co‐expression of Iba‐1 and M1/M2 phenotype markers. (A) Medial PFC co‐stained for Iba‐1 (microglia marker, red) and CD86 (M1 marker, green) and the quantification of CD86‐ and Iba‐1‐positive cells were shown in the right side (n = 8 per group). (B) Medial PFC co‐stained for Iba‐1 (red) and CD206 (M2 marker) (green) and the quantification of CD206‐ and Iba‐1‐positive cells were shown in the right side (n = 8 per group). Bars represent the mean ±SEM. ##P < 0.01 vs. control mice; *P < 0.05, **P < 0.01 vs. AAV2vehicle; &P < 0.05 vs. AAV2FBXO10
