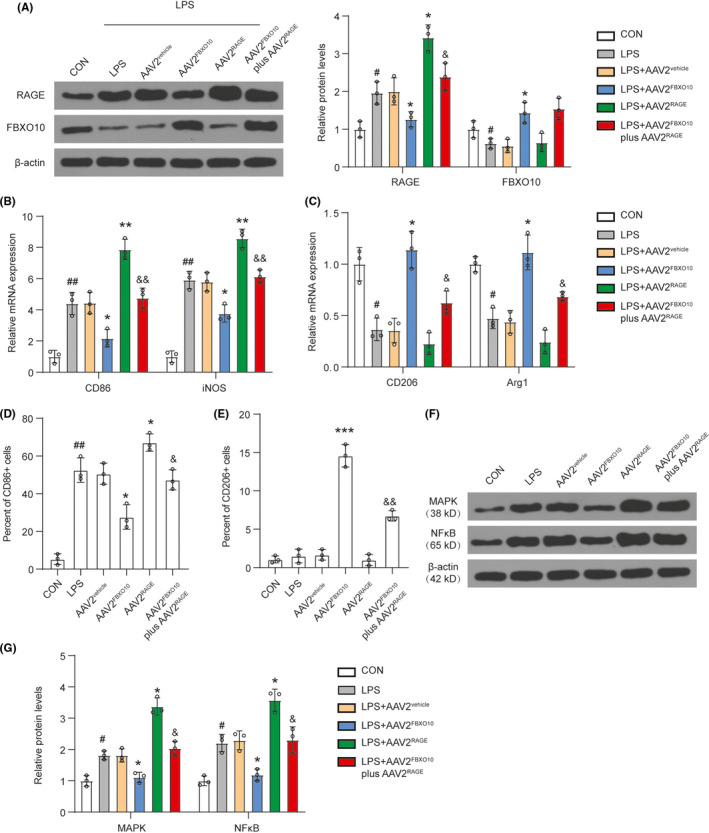
FIGURE 8.

FBXO10/RAGE axis participates in LPS‐induced microglia polarization in vitro. BV2 cells with or without infection were treated with LPS for 16 h. (A) The protein levels of FBXO10 and RAGE in BV2 cells were detected by Western blotting. (B) The mRNA levels of M1 markers (CD86 and iNOS) were detected by qRT‐PCR. (C) The mRNA levels of M2 markers (CD206 and Arg1) were detected by qRT‐PCR. (D‐E) Surface expressions of CD86 and CD206 in BV2 cells after indicated treatment were detected by flow cytometry. The percentage of CD86+ and CD206+ cells in the microglia was determined. (F‐G) The protein levels of p38 MAPK and NF‐κΒ in BV2 cells were detected by Western blotting. Bars represent the mean ±SEM. #P < 0.05, ##P < 0.01 vs. control group; *P < 0.05, **P < 0.05, ***P < 0.01 vs. AAV2vehicle; &P < 0.05, &&P < 0.01 vs. AAV2FBXO10; n = 8 per group
