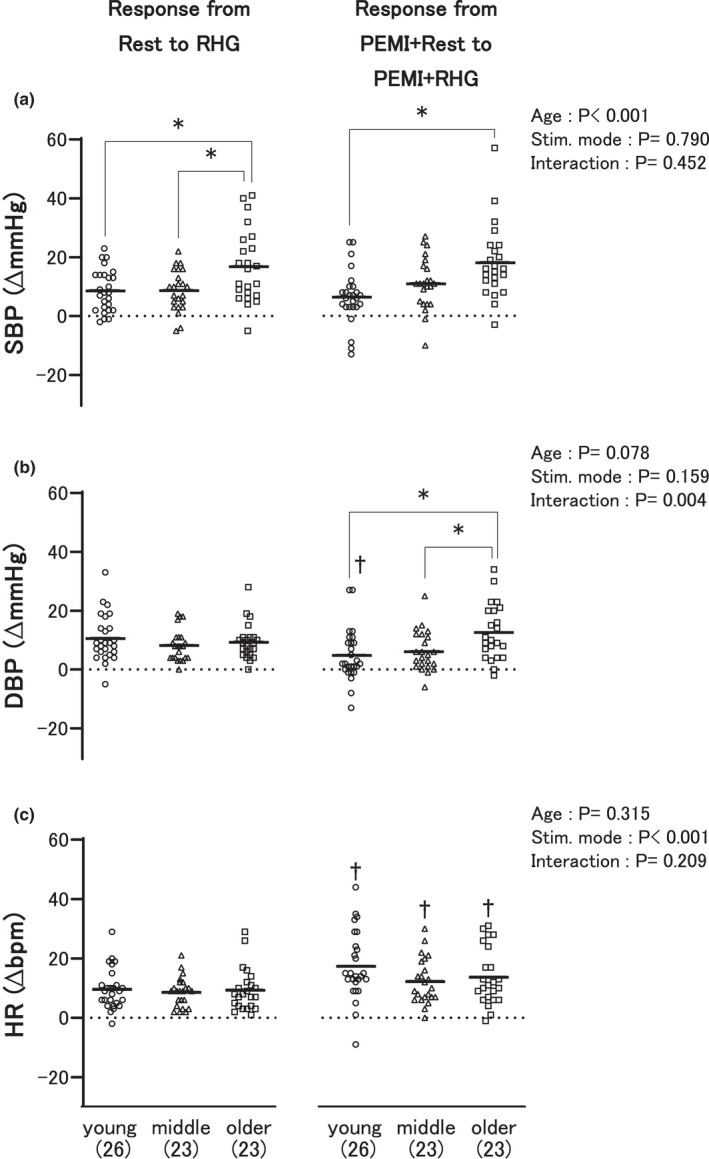
FIGURE 3.

Comparisons of the circulatory responses between the three age groups from the first baseline rest to rhythmic handgrip (RHG) exercise (left) and from the second baseline rest (PEMI + Rest) to RHG exercise (PEMI + RHG) during postexercise muscle ischemia (PEMI) (right). The first and second baselines are explained in Figure 1. SBP (a), DBP (b), and HR (c) indicate systolic and diastolic blood pressure, and heart rate, respectively. “Young,” “middle,” and “older” represent the young, middle‐aged, and older adult groups, respectively. *p < 0.05; † p < 0.05 versus RHG in each group. The number of participants is shown in parentheses. The dots and bars illustrate individual and mean values, respectively
