
FIGURE 1.
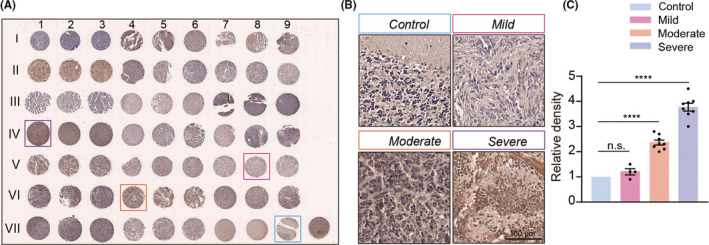
Increased expression of Rack1 in human medulloblastoma samples. (A) Paraffin‐embedded tissue array from human MB samples. The tissues in VII 7–9 are normal human cerebellum as control, and the sample in the lowest right corner is from pheochromocytoma in adrenal gland. (B) Different expression levels of Rack1 in various human MB samples. The expression level of Rack1 was divided into three levels including mild, moderate, and severe compared to normal control cerebellum. VIII 9, control; V 8, mild; VII 4, moderate; IV 1, severe. Scale bar = 100 μm. (C) Quantitative analysis of the relative density of Rack1 expression in different human MB samples (mean ± SEM). ****p < 0.0001, n > 3