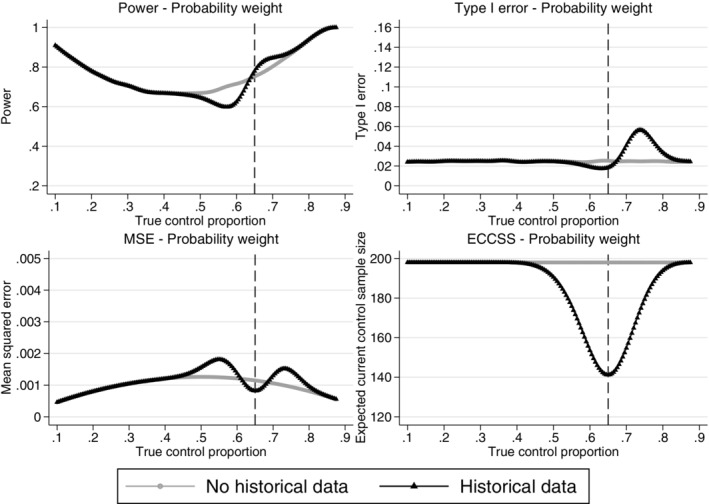
FIGURE 4.

Comparison of the power, type I error, mean squared error and expected current control sample size across different true current control proportions for the adaptive design using the probability weight approach and a standard design incorporating no historical data. Example, historical data 65/100 responses, n c = n t = 200, n c1 = 100, nmin = 20 and Δ = 12%. The vertical dashed lines represent complete agreement between the historical and current control proportions. ECCSS, expected current control sample size; MSE, mean squared error
