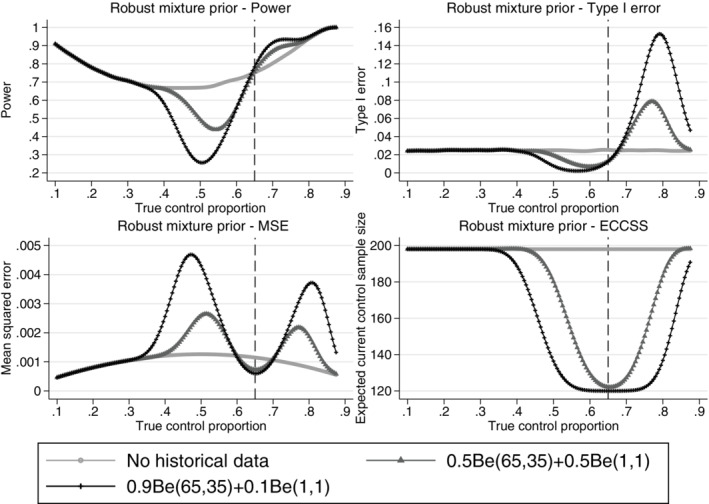
FIGURE 7.

Comparison of the power, type I error, mean squared error and expected current control sample size across different true current control proportions for the adaptive design using the robust mixture prior approach with 0.9 and 0.5 initial weight on the informative component of the mixture prior and a standard design incorporating no historical data. Example, historical data 65/100 responses, n c = n t = 200, n c1 = 100, nmin = 20 and Δ = 12%. The vertical dashed lines represent complete agreement between the historical and current control proportions. ECCSS, expected current control sample size; MSE, mean squared error
