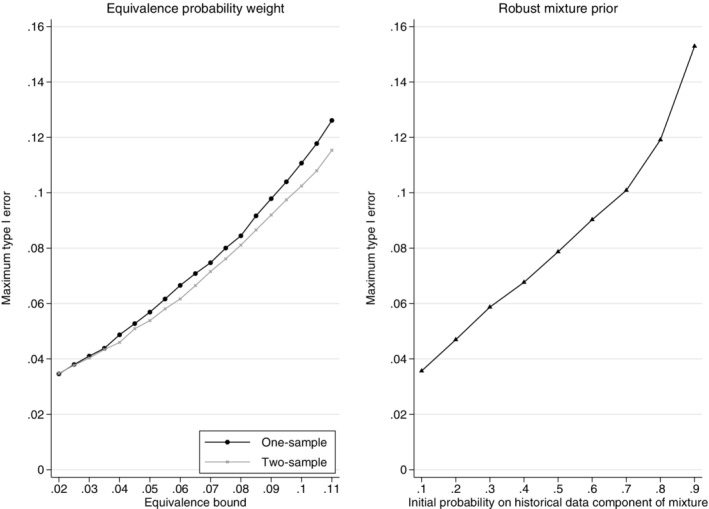
FIGURE 9.

Distribution of the maximum possible type I error across a range of equivalence bounds using the one‐sample and two‐sample equivalence probability weight approaches (left plot) and the distribution of the maximum possible type I error across a range of initial mixture prior probabilities on the informative component of the robust mixture prior for the adaptive design (right plot). Example, historical data 65/100 responses, n c = n t = 200, n c1 = 100, nmin = 20 and Δ = 12%
