
Figure 5.
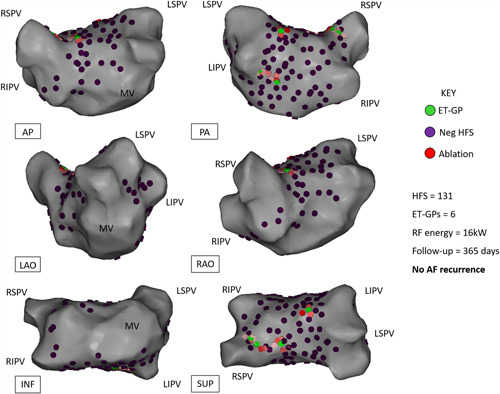
Example of a patient who had ET‐GP ablation and free from AF/AT at 12‐month follow‐up. Different projections of the left atrial CARTO™ 3D map are shown. Six ET‐GPs were identified and ablated. This was a 53‐year‐old male with hypertension, normal left ventricular systolic function, and normal left atrial size. AP, anterior–posterior; ET‐GP, ectopy‐triggering ganglionated plexus; HFS, high‐frequency stimulation; INF, inferior; LAO, left anterior oblique; LIPV, left inferior pulmonary vein; LSPV, left superior pulmonary vein; PA, posterior‐anterior; RAO, right anterior oblique; RF, radiofrequency; RIPV, right inferior pulmonary vein; RSPV, right superior pulmonary vein; SUP, superior