Figure 2.
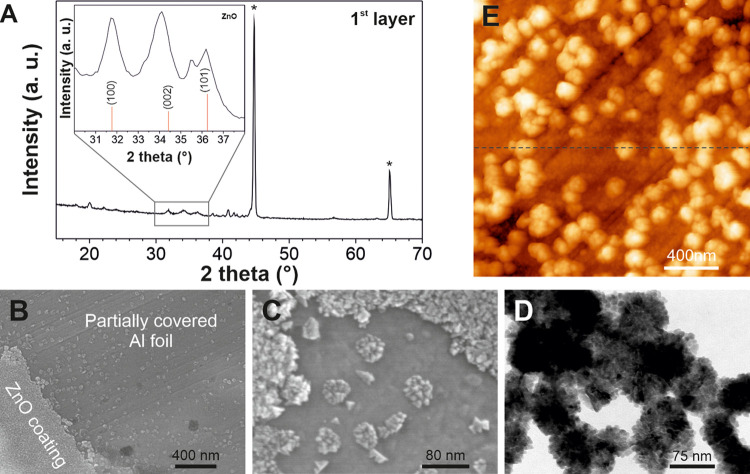
(A) XRD diffractogram of the ZnO-modified Al substrate after thermal treatment at 280 °C for 3 h. The inset shows the range between 30 and 38° and the associated ZnO database pattern (JCPDS file 01-079-0206, in red). (B, C) HR-SEM top-view micrographs of the ZnO-modified Al substrate after the thermal treatment at different magnifications. (D) TEM image of the branched ZnO NPs. (E) AFM topography of the ZnO nanoparticles covering the aluminum substrate. The corresponding height profile of the dashed line is shown in Figure S1D.

