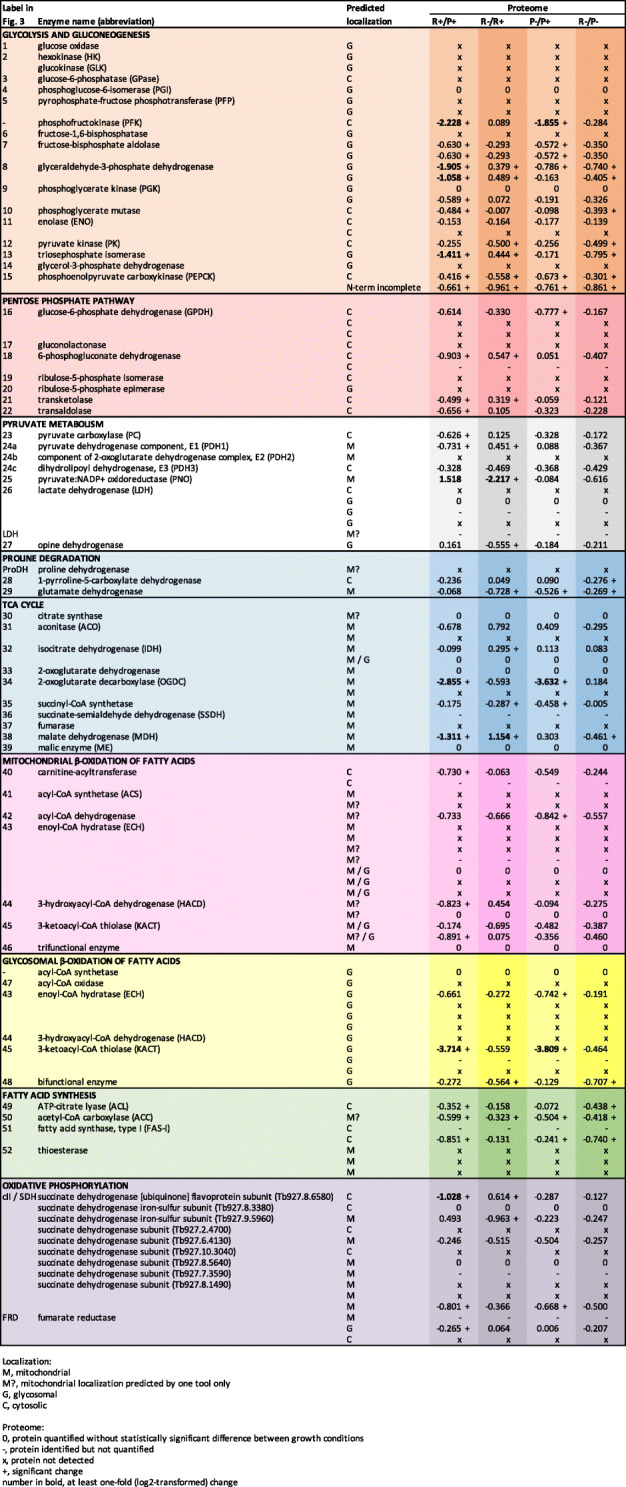
Table 1.
List of enzymes identified in transcriptome and proteome of D. papillatum. Abbreviations used for cellular localization and proteomic data are explained below the table. Transcriptomic and proteomic data are represented as log2-transformed ratios. ANOVA was performed with Benjamini-Hochberg correction for multiple testing with a p-value threshold at 0.01. For pairwise comparisons, post hoc Tukey’s test was used at P ≤ 0.01. Differentially abundant proteins were filtered on effect size, at least 1-fold of log2-transformed ratio. Abbreviations in column headings: rich medium (R), poor medium (P), aerobic conditions (+), hypoxic conditions (-)

