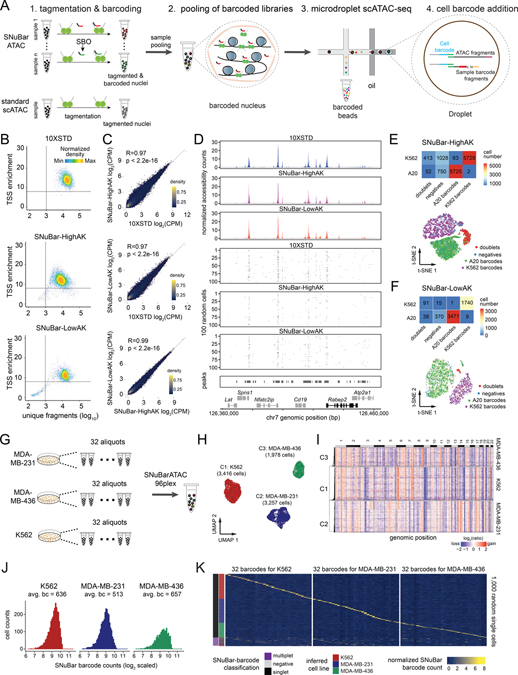
Figure 1. SNuBar-ATAC workflow and technical performance.
(A) Overview of the SNuBar-ATAC workflow. Compared to the standard 10X scATAC workflow, SNuBar-ATAC involves adding a unique SBO oligonucleotide to each sample during the tagmentation step to perform sample multiplexing. The barcoded samples are then pooled together and loaded into a microdroplet platform (10X Genomics) to perform scATAC-seq.
(B) SNuBar-ATAC quality control plots for A20 cells from the 10X (10XSTD), SNuBar-HighAK and SNuBar-LowAK experiments, in which each dot represents one droplet with at least 100 fragments.
(C) Comparison of the aggregated counts per million (CPM) fragments within peaks for the A20 cell line in 10XSTD, SNuBar-HighAK, and SNuBar-LowAK.
(D) Comparison of scATAC profiles of the A20 cells from the 10XSTD, SNuBar-HighAK, and SNuBar-LowAK experiments in a region of chromosome 7. Upper panels show the aggregated profiles of all cells and lower panels show fragments present in each of the 100 random cells.
(E-F) Upper panels show a heatmap of cell numbers from different species determined by barnyard analysis (rows) and SNuBar barcode classifications (columns). Lower panels show a t-SNE plot colored by the SNuBar barcode classifications for SNuBar-HighAK (E) and SNuBar-LowAK (F).
(G) Experimental workflow used to assess the scalability of SNuBar-ATAC by multiplexing 96 samples from three cell lines.
(H) UMAP of the scATAC-seq profiles from MDA-MB-231, MDA-MB-436, and K562 cells.
(I) Clustered heatmap showing copy number aberrations inferred from the 96-plex SNuBar-ATAC data.
(J) Histogram showing the frequencies of SBO counts in the singlets from the three cell lines.
(K) Heatmap showing the normalized SBO counts from 1,000 random single cells with the SNuBar classifications and the inferred cell lines indicated.
See also Figures S1, S2 and Table S1.

