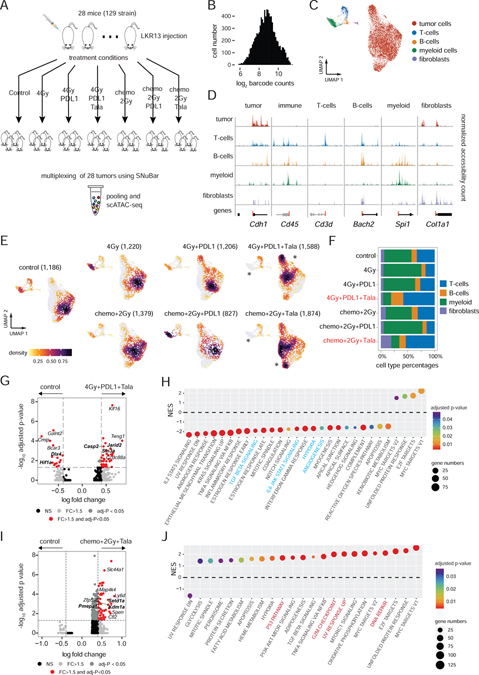
Figure 2. Multiplexing of therapeutic treatment conditions from a lung cancer model.
(A) Experimental workflow for the treatment combinations used to treat syngeneic mice with LKR13 lung cancer cell line injections.
(B) SNuBar-ATAC barcode distribution for single cells.
(C) UMAP projection of scATAC profiles of tumor and non-malignant cell types from all mice samples across all treatment conditions.
(D) Track plots showing the normalized fragment counts per cell type within the TSS-flanking regions of the known genes for specific cell types.
(E) UMAP projection of scATAC profiles showing cells per treatment group colored by cell densities, with star symbols highlighting differences in cell clusters between the treatment and control groups. The total cell number of each group are indicated in brackets.
(F) Barplot showing the microenvironment cell type percentages in each treatment group.
(G) Volcano plot showing the DAPs in the tumor cells between 4Gy+PDL1+Tala and the control group.
(H) NES (normalized enrichment score) of significantly enriched pathways reported by the module-based GSEA using the up-regulated DAPs in 4Gy+PDL1+Tala compared with the control group.
(I) Volcano plot showing the DAPs within the tumor cells in a comparison between Chemo+2Gy+Tala and the control group.
(J) NES of significantly enriched pathways reported by the module-based GSEA using the up-regulated DAPs in the Chemo+2Gy+Tala group compared with the control group.
See also Figures S3.

