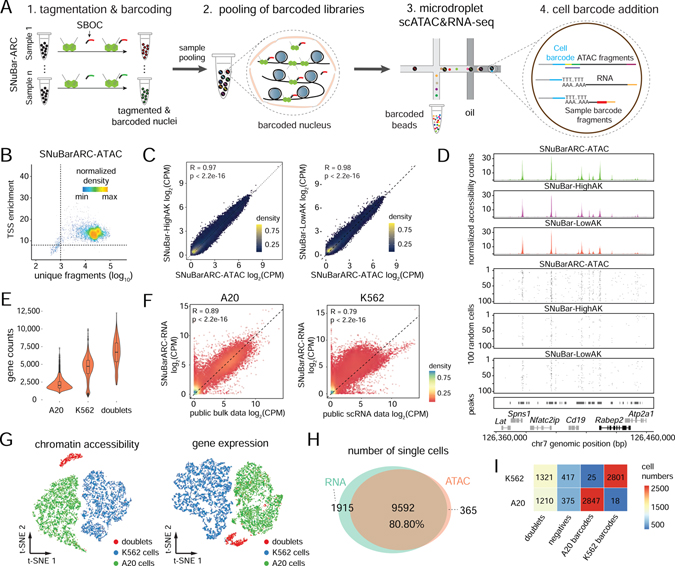
Figure 4. Multiplexing of cell lines by SNuBar-ARC.
(A) Overview of scATAC&RNA co-assay in which a single SBOC oligonucleotide is added during the tagmentation step to perform sample multiplexing in SNuBar-ARC. After barcoding, single nuclei are pooled together, and the libraries are loaded into the microdroplet-based scATAC&RNA co-assay.
(B) Quality control for the scATAC data from the A20 cells in SNuBar-ARC.
(C) Comparison of log-normalized fragments within peaks for aggregated A20 cells in SNuBar-ARC, SNuBar-HighAK and SNuBar-LowAK. Each dot denotes a peak.
(D) Comparison of scATAC profiles of the A20 cells from the SNuBar-ARC, SNuBar-HighAK, and SNuBar-LowAK experiments in a genomic region on chromosome 7. Upper panels show aggregated fragments of all cells and lower panels show fragment present in each of the 100 random cells.
(E) Detected gene counts of each single nucleus from A20, K562 and doublet cells using the RNA assay of SNuBar-ARC.
(F) Comparison between the aggregated scRNA data of A20, K562 cells and the public datasets with Pearson’s R and p-values indicated. Each dot represents a gene.
(G) t-SNE projection of chromatin accessibility and gene expression profiles from A20 and K562 cells in the SNuBar-ARC experiments.
(H) Venn diagram showing number of cells detected by one or both assays in SNuBar-ARC.
(I) Heatmap of cell numbers from different species determined by barnyard analysis (rows) and SNuBar barcode classifications (columns).
See also Figure S4.

