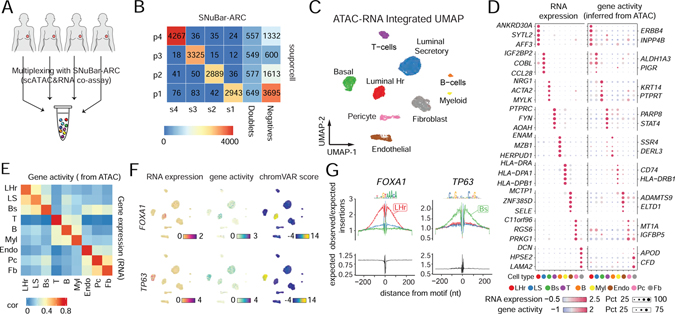
Figure 5. Multiplexing of human tissue samples by SNuBar-ARC.
(A) Overview of SNuBar-ARC experimental workflow for multiplexing 4 human breast tissues.
(B) Heatmap of cell numbers from the 4 samples determined by “souporcell” (rows) and SNuBar barcode classifications (columns).
(C) UMAP projection of all single cells based on the weighted-nearest neighbor (wnn) graph integrating the RNA and ATAC modalities. Cells (dots) are colored by the cell types.
(D) Dotplot showing the RNA expression and gene activity (inferred from ATAC) of top 5 DEGs per cell type. The dot color represents the scaled average values. The dot size indicates the percentage of cells in which the gene is detected.
(E) Heatmap showing Pearson correlation of RNA expression and gene activity across different cell types.
(F) UMAP projection of all single cells colored by the RNA expression, gene activity and TF binding potential (measured by chromVar) of FOXA1 and TP63.
(G) Footprints of the TFs FOXA1 and TP63 in three different epithelial cell types (LHr, LS, Bs). The bottom panels showing the Tn5 insertion bias track.
See also Figure S5.

