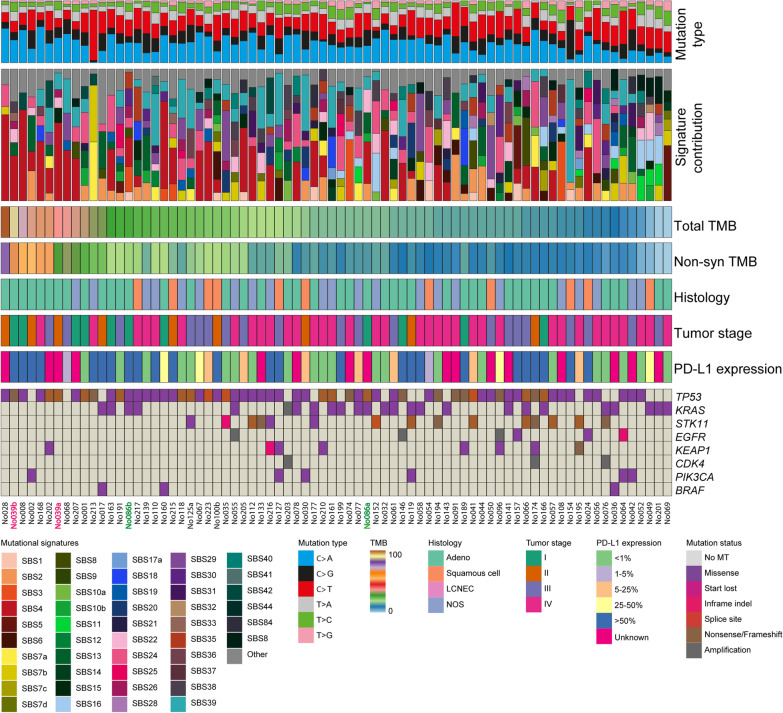
Fig. 2.
Clinicopathological and molecular features of lung tumor samples with ≥ 30 somatic SBS in genes covered by the TSO500 panel. Samples are sorted from left-to-right based on high-to-low total TMB. Every column represents one tumor sample. Numbers indicated in purple and green indicate two independent tumors (not clonally related) from the same individual. Only lung cancer related genes in which 2 or more somatic mutations or amplifications were detected are included. TMB tumor mutational burden, Non-syn non-synonymous, MT mutation, NOS not otherwise specified, LCNEC Large cell neuroendocrine carcinoma, SBS single base substitution

