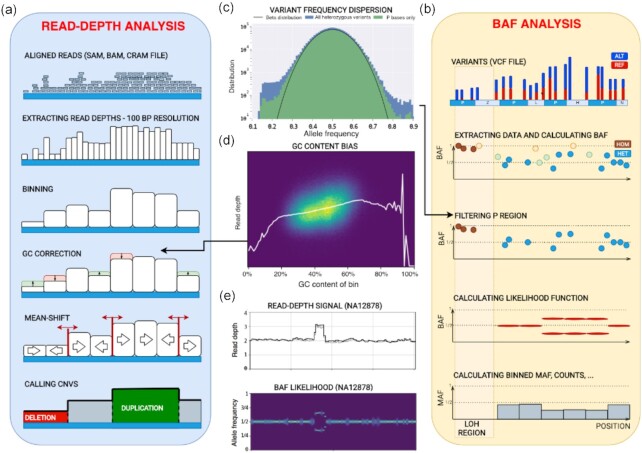
Figure 1:
Schematics of core algorithm and data processing steps. (a) Read depth analysis steps include parsing alignment file, calculating and storing read depths in 100-bp intervals, binning using user-specified bin size, correcting RD for GC bias, segmenting by mean-shift, and calling CNVs. (b) B-allele frequency (BAF) analysis steps include reading variant file, storing the data about SNPs and small indels, filtering variants using strict mask, calculating BAF for heterozygous variants (HETs), and calculating likelihood function for bins. For CNVs, BAF signal splits away from value 0.5 expected for HETs. (c) Distribution of the variant allele frequency for all variants and variants within strict mask as defined by the 1000 Genomes Project. Black line shows fit by Gaussian distribution. (d) An example of RD depending on GC within bin. Statistics of RD signal within bins of the same percentage of GC content is used to correct for GC bias in the signal. White line represents average RD level for bins with given GC content. (e) An example of RD and BAF signals for a germline duplication in NA12878 sample (raw RD signal is in grey, GC-corrected RD signal is in black, brighter color of BAF likelihood corresponds to higher values of the likelihood).

