. 2015 Jan 28;85(6):969–979. doi: 10.2319/102214-765.1

Figure 6.

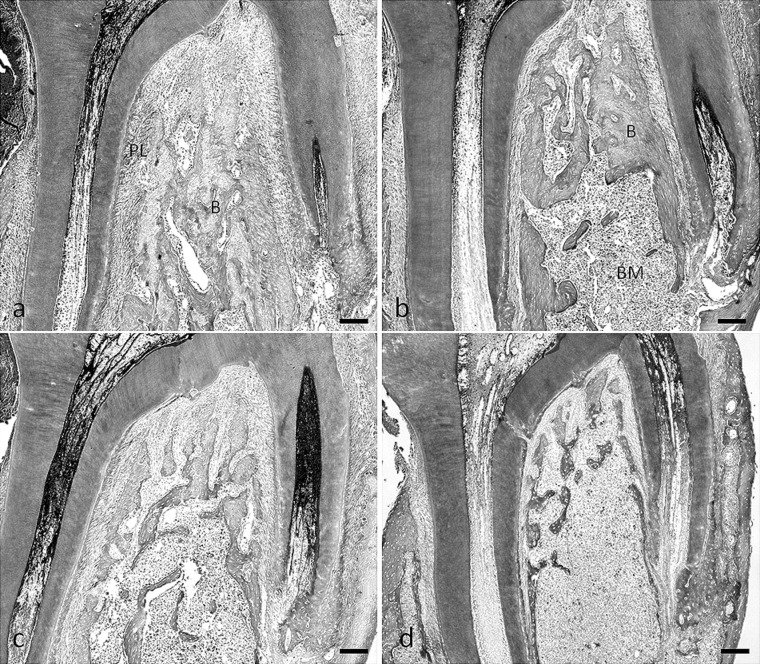
Figure 6. Photomicrographs of tissue stained with hematoxylin and eosin illustrating the furcation region of the mandibular first molar in the rats fed the normal-calcium (a, hard; b, soft) and low-calcium (c, hard; d, soft) diets. B indicates bone; BM, bone marrow; PL, periodontal ligament area. Bar  =  100 µm.

Photomicrographs of tissue stained with hematoxylin and eosin illustrating the furcation region of the mandibular first molar in the rats fed the normal-calcium (a, hard; b, soft) and low-calcium (c, hard; d, soft) diets. B indicates bone; BM, bone marrow; PL, periodontal ligament area. Bar  =  100 µm.