
FIG 3.
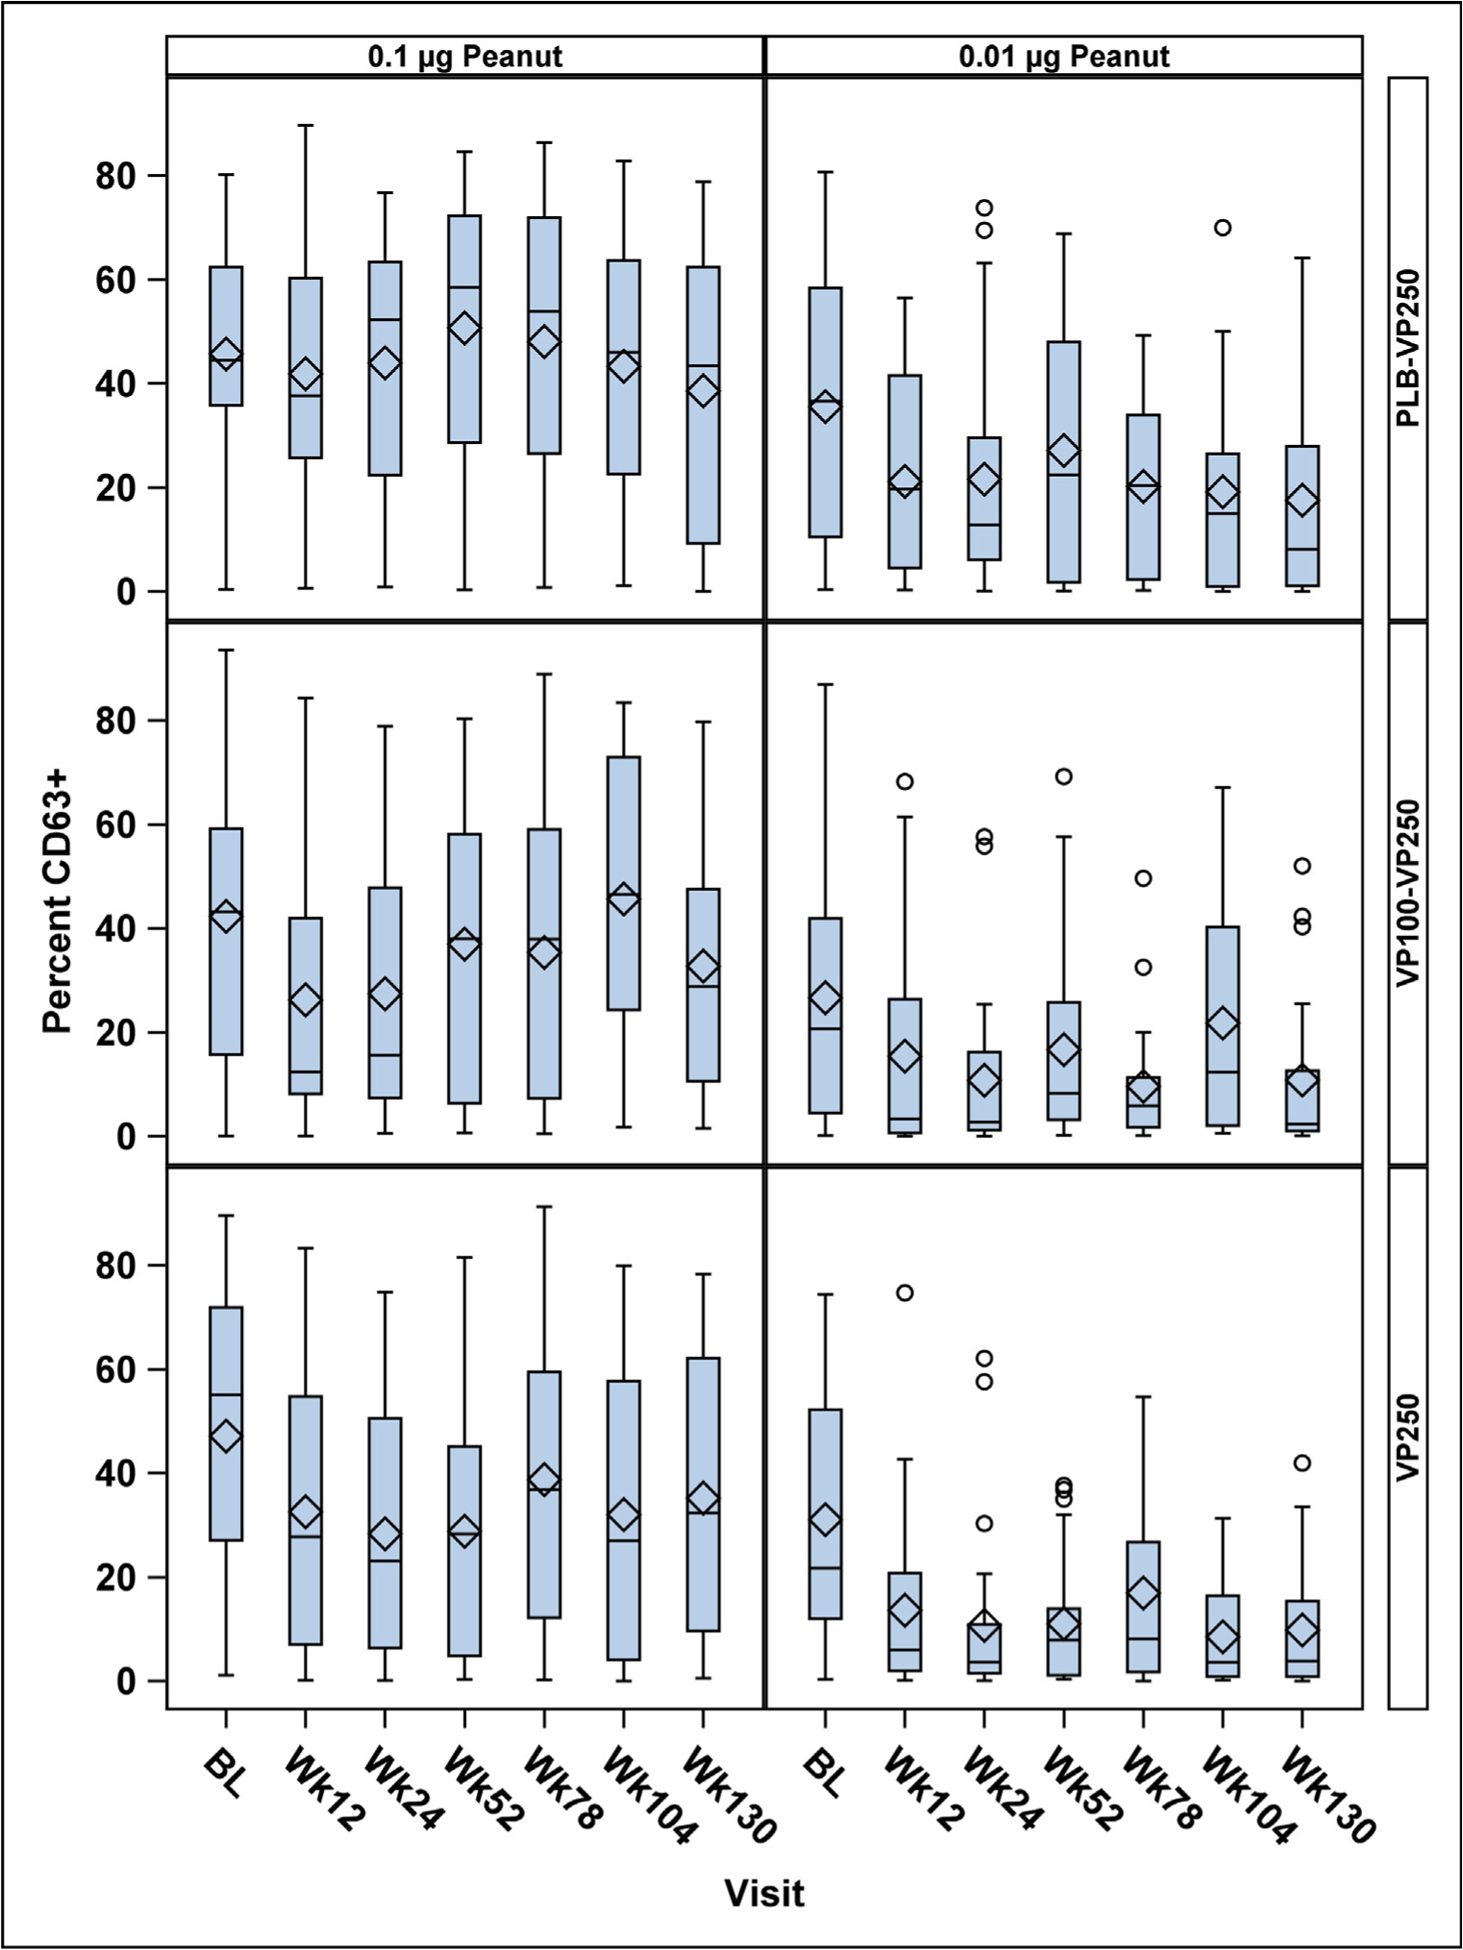
Effect of peanut EPIT on basophil activation (measured by percent CD63+ basophils) over time by treatment group. Top row, PLB-VP250 group; middle row, VP100-VP250 group; bottom row, VP250 group. Cells were stimulated with 0.1 μg/mL peanut extract (column 1) and 0.01 μg/mL peanut extract (column 2). A decrease in the percentage of CD63+ basophils over time was observed only following stimulation with 0.01 μg/mL peanut extract, and statistically significant differences between treatment groups over time were not observed. These are box plots, with the lines inside each box representing the median and the diamonds representing the mean.