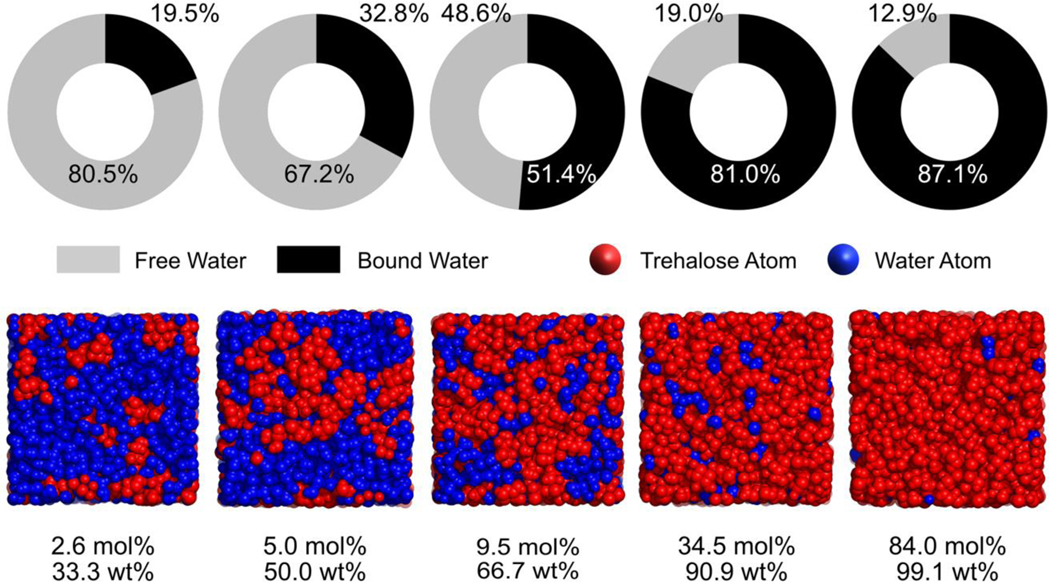
Figure 5.
Shares of “bound” and “free” water in trehalose-water mixtures at 295 K (upper panel); Snapshots of the MD simulation box showing the water or trehalose percolation at each of the trehalose–water concentrations under investigation (lower panel, 295 K). This figure was created using the raw data from Ref (33).

