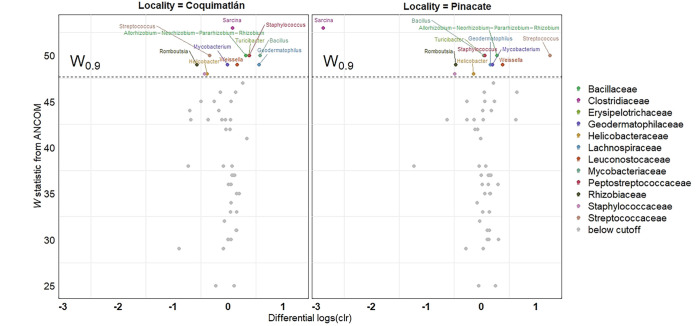
FIG 7.
Differential abundance of taxa (center log ratios) observed in the gut microbiomes of bats captured in the dry forest biome (Chamela versus Coquimatlán) (left) and in the dry forest and desert biomes (Chamela versus Pinacate) (right). ASVs are colored by family only when the cutoff W value of 0.9 was met. Each differentially abundant ASV is labeled according to the genus.

