FIG 2.
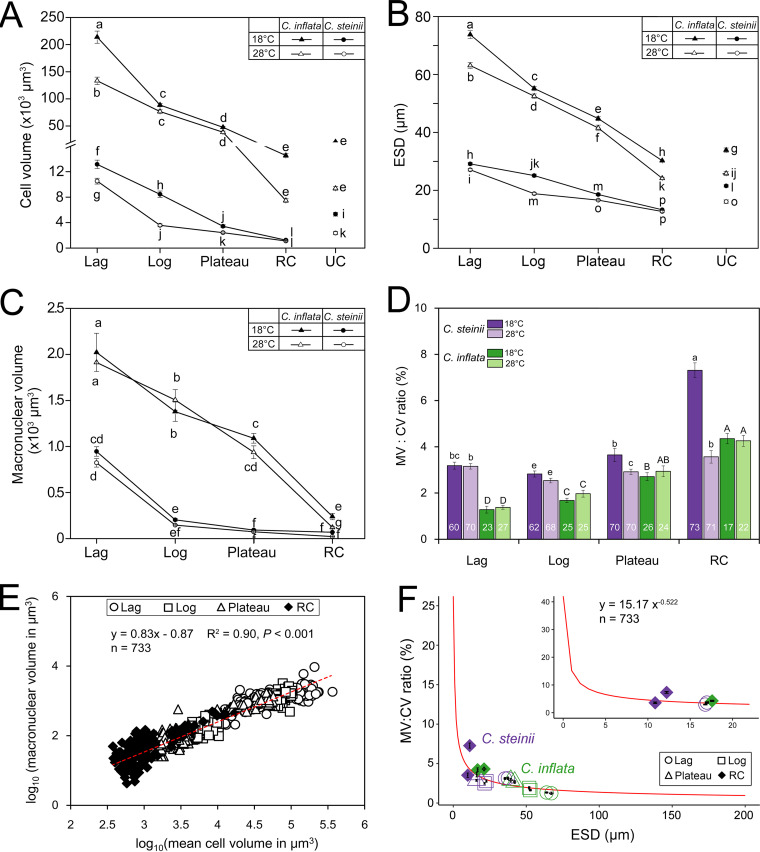
Variation in phenotypic traits of Colpoda steinii and C. inflata across life cycle stages and at two temperatures. Unconnected points in line graph panels indicate unstable cysts. (A) Cell volume progressively decreased from lag to resting cyst phases. In general, unstable cysts were larger than resting cysts. Cells at a given growth phase were consistently larger at 18°C than at 28°C. (B) Equivalent spherical diameter (ESD) progressively decreased from lag to resting cyst phases. (C) Macronuclear volume changed similarly to cell volume across stages but was mostly not significant between the two temperatures. (D) Ratio of macronuclear to cell volume (MV/CV) across life cycle stages. Numbers in the bars indicate the numbers of cells counted. (E) A linear log-log relationship between macronuclear (MV) and cell volumes (CV) across life cycle stages (lag, log, plateau, and RC). (F) A modeled scaling relationship between MV/CV ratio and equivalent spherical diameter (ESD). Nucleocytoplasmic ratio varies dramatically in small cells (e.g., pico- [< 2 μm] and nano-sized protists [∼2 to ∼20 μm]) but changes only slightly in large cells (e.g., microplanktons [∼20 to ∼200 μm]). Not sharing common letters indicates significant differences (P < 0.05). RC, resting cyst; UC, unstable cyst.

