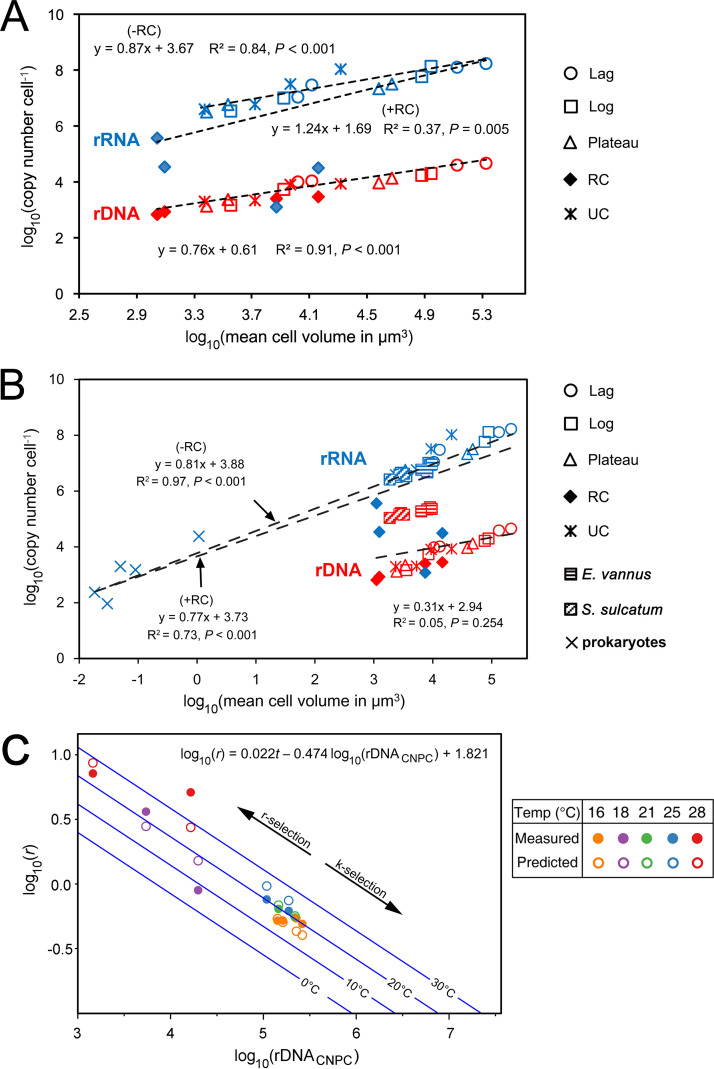
FIG 4.
Scaling relationships among ribotypic traits, growth rate, and cellular attributes. (A) The per-cell rDNA and rRNA copy numbers (CNs) in two Colpoda species across life cycle stages were significantly related to cell volume. (B) Scaling relationships based on a combined data set consisting of two Colpoda species (present study), Euplotes vannus, and Strombidium sulcatum and five prokaryotic species (9). The per-cell rRNA CNs are better predicted using cell volume when resting cysts (indicated by four symbols of solid diamond in blue) are excluded from the regression analysis (−RC) than when the resting cystic data are incorporated (+RC). The rDNA CNs of E. vannus and S. sulcatum were much higher than those of Colpoda cells with similar size ranges, suggesting that rDNA CN and CV relationship may be conserved among closely related taxa but becomes inconsistent among distant taxa. (C) Maximum growth rates (r) of Colpoda steinii, C. inflata, E. vannus, and S. sulcatum can be well predicted by rDNA CN per cell (CNPC) and temperature (t). Lines in blue denote predicted growth rate-CNPC relationships at 0, 10, 20, and 30°C. The amount of rDNA copies in genomes is inversely related to the growth potential of the cell, which might underline r and K selection of these organisms. RC, resting cysts; UC, unstable cysts.

