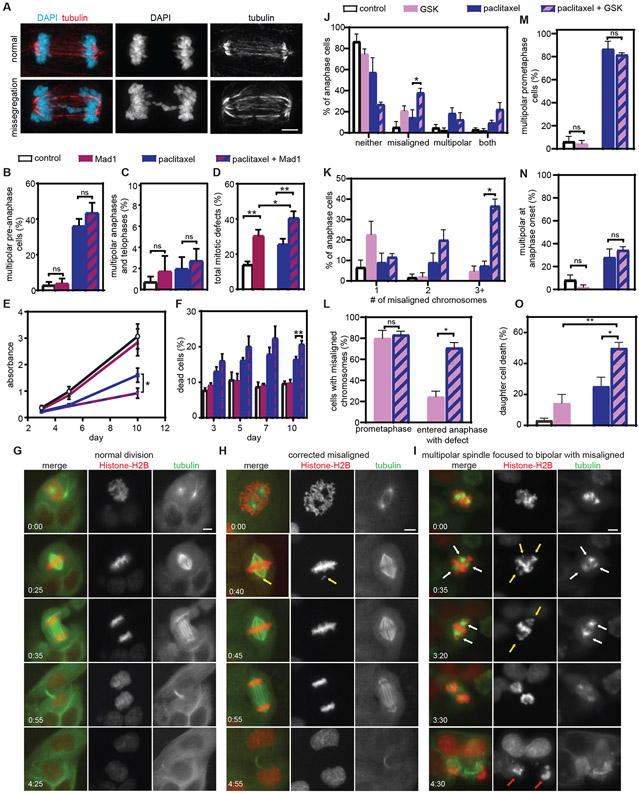
Fig. 6: Increasing chromosomal instability sensitizes Cal51 cells to paclitaxel in vitro.
A) Representative images of a normal bipolar anaphase (top) and a bipolar anaphase with evidence of chromosome missegregation (lagging chromosome, bottom). Scale bar, 5 μm. B-F) Cells were treated with vehicle, tet to induce Mad1, 10 nM paclitaxel, or tet and paclitaxel. Mean percentage +/− SEM of multipolar spindles prior to anaphase (B, n≥100 cells in each of three biological replicates) and after anaphase onset (C, n≥ 50 anaphase and telophase cells in each of three biological replicates). D) Quantification of the incidence of total mitotic defects observed by fixed analysis. n≥50 anaphase and telophase cells in each of five biological replicates. E) MTT survival assay. Data represent the mean +/− SEM from three biological replicates. F) Cell death (mean +/− SEM), measured using trypan blue exclusion assays. n=3. G-O) Cal51 cells treated with vehicle, CENP-E inhibitor GSK923295, 5 nM paclitaxel, or both. G-I) Still images from timelapse analysis of Cal51 cells with fluorescent chromosomes and microtubules due to endogenous tagging of histone H2B with mScarlet and α-tubulin with mNeonGreen, respectively. Time is indicated in hours:minutes. Scale bar, 5 μm. G) Normal bipolar division. H) Division in GSK923295, in which a misaligned chromosome, indicated by a yellow arrow, aligns prior to anaphase onset. I) Division in combination of 5 nM paclitaxel and 50 nM GSK923295 in which the prometaphase spindle contains multiple spindle poles (indicated by white arrows), focuses into a bipolar spindle prior to anaphase onset (time 3:20) and enters anaphase in the presence of multiple misaligned chromosomes (yellow arrows). Both daughter cells die by 4:30 (red arrows). J-N) Quantitation of mitotic defects at anaphase onset (J), number of misaligned chromosomes at anaphase onset (K), percentage of cells with misaligned chromosomes in prometaphase and at anaphase onset (L), and spindle polarity before (M) and at (N) anaphase onset. O) Percent daughter cell death. Data represent the mean (+/− SEM) from 3 48-hour movies. *P<0.05. **P<0.001. ns=not significant.

