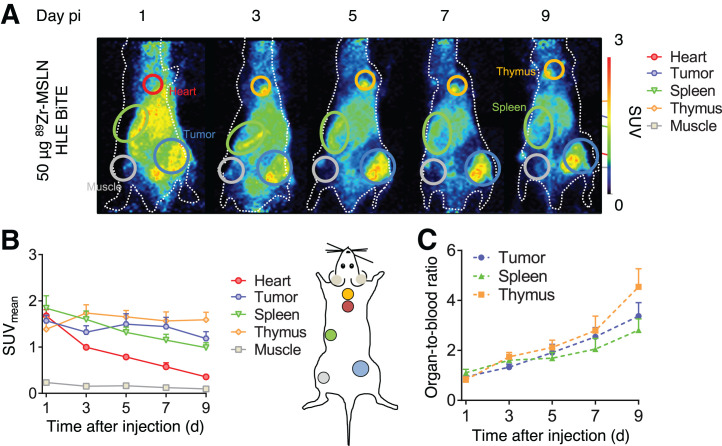
FIGURE 1.
PET scans over time after administration of 50 μg of 89Zr-mesothelin HLE BiTE in 4T1-tumor–bearing mice (n = 8). (A) Representative maximum-intensity projections of PET images up to 9 d after tracer injection. Encircled are spleen (green), heart (red), tumor (blue), and thymus (yellow). (B) Image quantification of heart, tumor, spleen, thymus, and muscle expressed as SUVmean. (C) Image quantification expressed as organ-to-blood ratios. Data are presented as mean ± SD. MSLN = mesothelin; pi = after injection.

