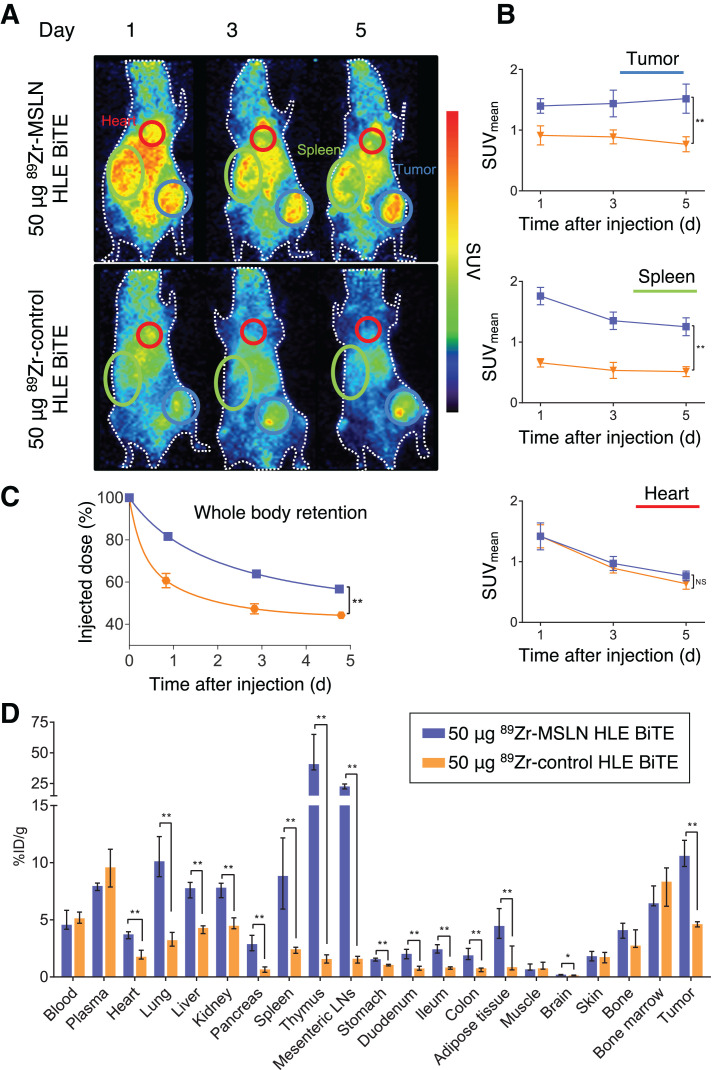
FIGURE 3.
Biodistribution of 50 μg of 89Zr-mesothelin HLE BiTE compared with 50 μg of 89Zr-control HLE BiTE. (A) Representative maximum-intensity projections of PET images at 1, 3, and 5 d after injection of 89Zr-mesothelin HLE BiTE (n = 6) or 89Zr-control HLE BiTE (n = 6). Encircled are spleen (green), heart (red), and tumor (blue). (B) PET quantification of tumor, spleen, and heart. (C) Whole-body retention measured by dose calibrator. Data are presented as mean ± SD. (D) Ex vivo biodistribution with data presented as median with interquartile range. LNs = lymph nodes; MSLN = mesothelin. *P ≤ 0.05. **P ≤ 0.01

