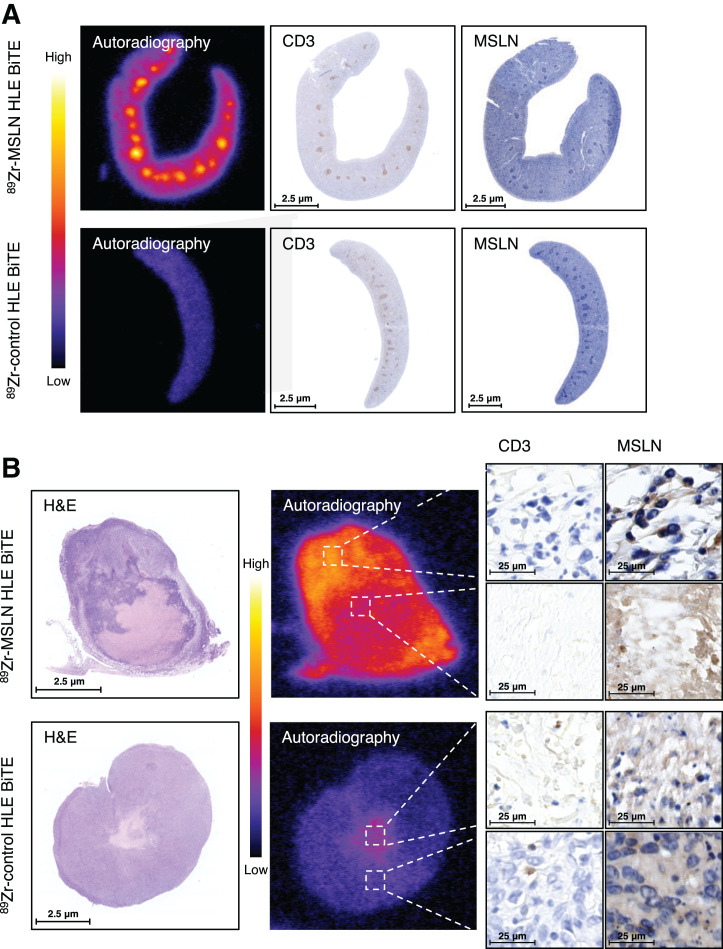
FIGURE 5.
Ex vivo analysis of spleen and tumor tissue (4T1) 5 d after injection of 50 μg of 89Zr-mesothelin HLE BiTE or 50 μg of 89Zr-control HLE BiTE. (A) Spleen tissue. From left to right are shown tissue autoradiography, CD3 immunohistochemistry, and mesothelin immunohistochemistry. (B) Tumor tissue. From left to right are shown H&E and tissue autoradiography, followed by CD3 immunohistochemistry and mesothelin immunohistochemistry of high- and low-uptake areas. In H&E panel, necrotic core is shown as lighter-staining region. MSLN = mesothelin.

