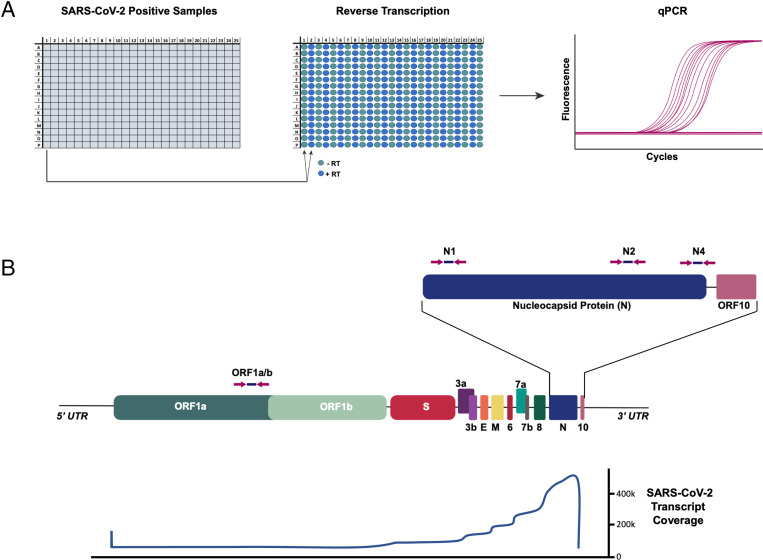
Fig. 1.
Analysis of SARS-CoV-2−positive samples for genomic SARS-CoV-2 DNA. (A) SARS-CoV-2−positive samples were consolidated in a 384-well plate. Each sample was run in duplicate RT reactions with or without RevT. Resulting reactions were assessed for SARS-CoV-2 complementary DNA by qPCR. (B) (Top) Schematic of SARS-CoV-2 genome. The qPCR primer/probe locations for N1, N2, N4 (3′ end), and ORF1ab (5′ end) are shown with arrows. (Bottom) Profile of RNA read depth across the viral genome as reported by refs. 4 and 5, showing strong bias of expression toward the 3′ end of the viral genome.

