Fig. 1.
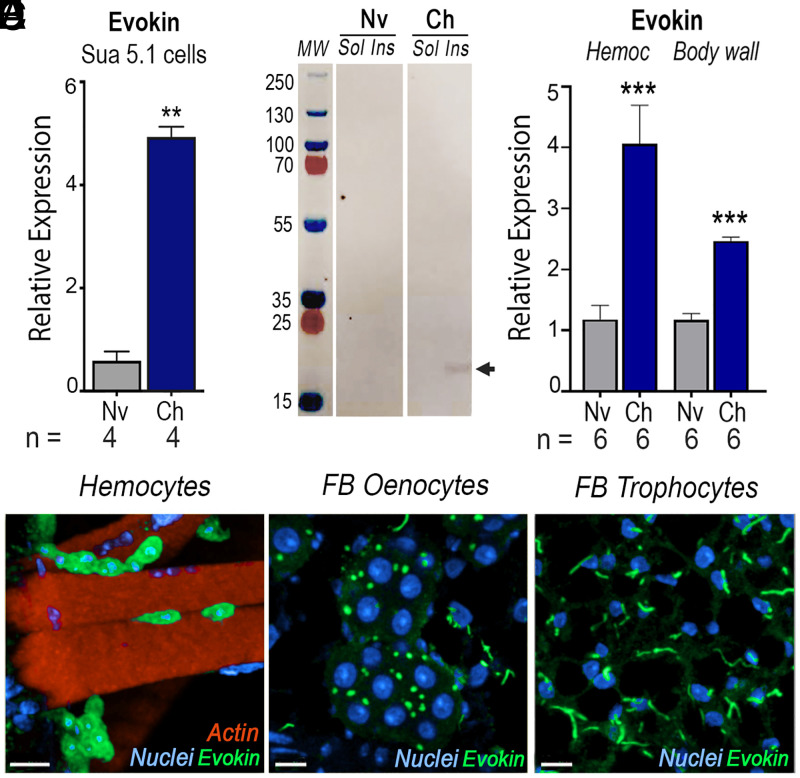
Effect of immune challenge of Sua 5.1 cells and mosquitoes on Evokin expression. (A and B) Effect of bacterial challenge on Sua 5.1 cells on (A) Evokin mRNA levels measured by qRT-PCR 1 d postchallenge and (B) Evokin protein expression (arrow) analyzed by Western blot. A Coomassie blue–stained gel is shown in SI Appendix, Fig. S1. (C) Effect of P. berghei infection on Evokin mRNA levels measured by qRT-PCR in mosquito hemocytes and body wall 7 d postinfection. (D–F) Localization of Evokin in (D) sessile, body wall–associated hemocytes, (E) oenocytes, and (F) trophocytes analyzed by immunofluorescence staining of naïve mosquitoes. (A and C) Means ± SEM are plotted and groups were compared using Student’s t test (**P < 0.01, ***P < 0.001). Each treatment had at least three biological replicates and the results were confirmed in at least two independent experiments. Cells from a single well of a six-well plate (A) or pools of 15 to 20 mosquitoes (C) were used. [Scale bars, 7 µm (D), 10 µm (E), and 10 µm (F).] Ch, challenged; fat body, FB; Hemoc, hemocytes; Ins, insoluble fraction; Nv, naïve; Sol, soluble fraction.

