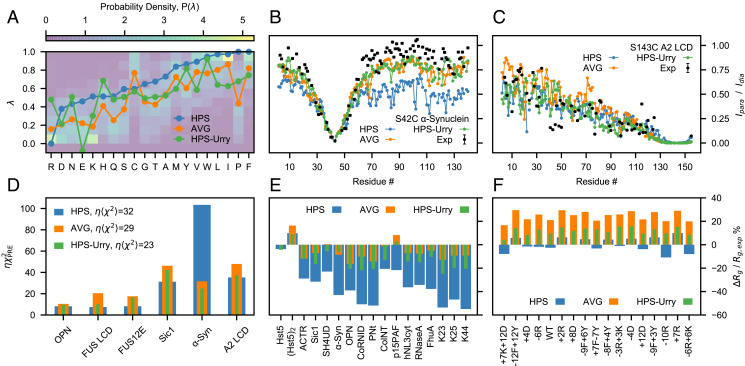
Fig. 1.
Assessing the HPS, AVG, and HPS-Urry models using experimental data reporting on single-chain conformational properties. (A) Probability distributions of the λ parameters calculated from 87 min–max normalized hydrophobicity scales. Lines are the λ parameters of the HPS model (blue), the average over the hydrophobicity scales (orange) and the HPS-Urry model (green) (28). Intramolecular PRE intensity ratios for (B) the S42C mutant of α-Synuclein and (C) the S143C mutant of A2 LCD from simulations and experiments (22, 43) (black). (D) values quantifying the discrepancy between simulated and experimental intramolecular PRE data, scaled by the hyperparameter (Materials and Methods). Relative difference between simulated and experimental radii of gyration (E) for proteins that do not readily undergo phase separation alone and (F) for variants of A1 LCD, with negative values corresponding to the simulated ensembles being more compact than in experiments.

