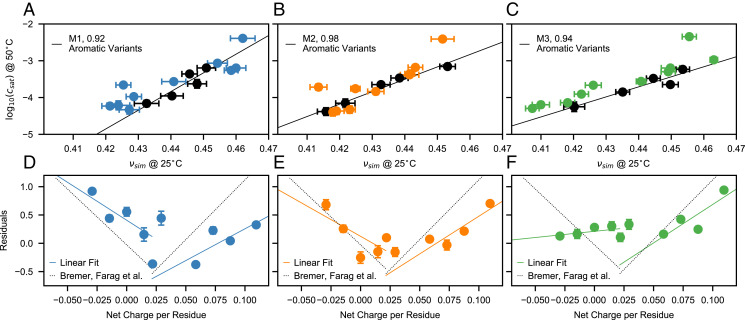
Fig. 7.
Correlation between chain compaction and LLPS propensity for aromatic and charge variants of A1 LCD. vs. νsim for A1 LCD variants from simulations performed using the (A) M1, (B) M2, and (C) M3 models. Black and colored circles indicate aromatic and charge variants, respectively. Black lines are linear fits to the aromatic variants. (D–F) Residuals from the linear fits of A–C for the charge variants of A1 LCD as a function of the NCPR. Values reported in the legends are Pearson’s correlation coefficients. Error bars of values are SEMs of averages over blocks of 0.3 µs. Error bars of νsim are SDs from fits to in the long-distance region, . Solid lines are linear fits to the data. Dotted lines in D–F are lines of best fit to the experimental data by Bremer et al. (16).

