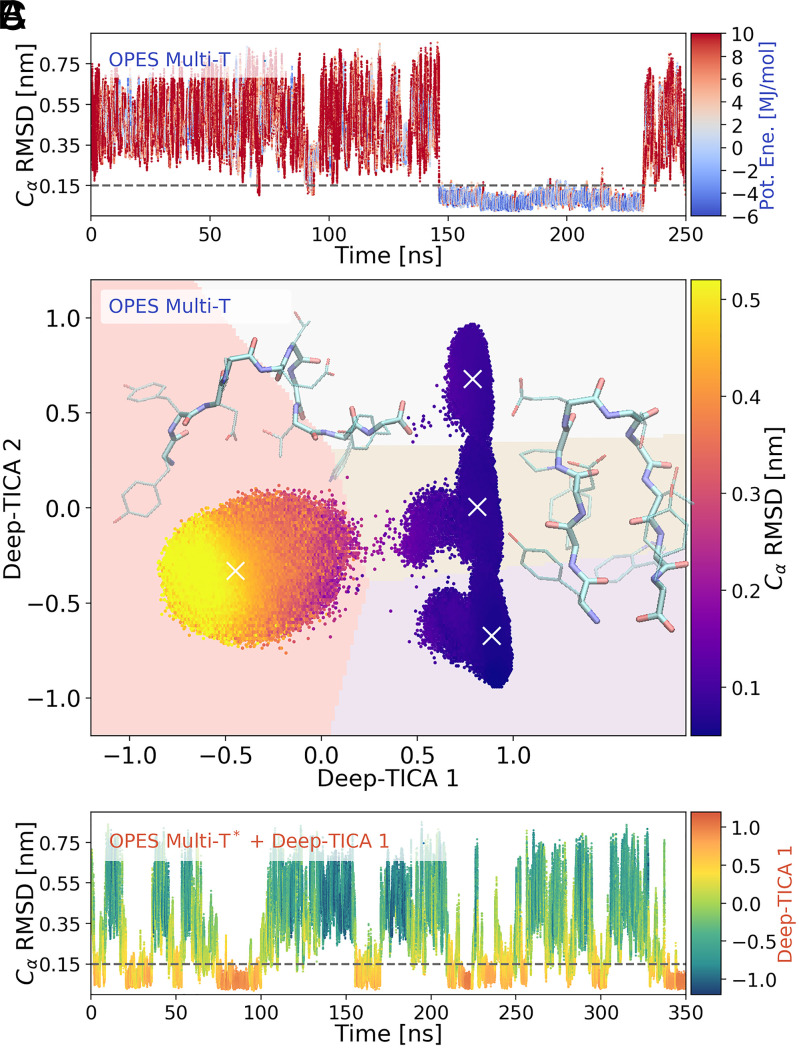
Fig. 4.
The Deep-TICA procedure applied to chignolin folding. (A) Time evolution of the rmsd for one replica during the initial multithermal run. The points are colored according to their potential energy value. Low energy values reflect the fact that configurations relevant at lower temperatures are sampled. (B) Scatterplot of the two leading Deep-TICA CVs in the exploratory simulation. Points are colored according to the average rmsd values. A weighted k-means clustering identifies four clusters whose centers are denoted by a white ×. The pale background colors reflect how space is partitioned by the clustering algorithm. Snapshots of chignolin in the folded (high values of Deep-TICA 1) and unfolded (low values of Deep-TICA 1) states are also shown, realized with the Visual Molecular Dynamics (VMD) software (69). (C) Time evolution of rmsd for a replica in the multithermal simulation also biasing Deep-TICA 1, colored with the value of the latter variable. The time evolution for the other replicas is reported in SI Appendix, Fig. S7.

