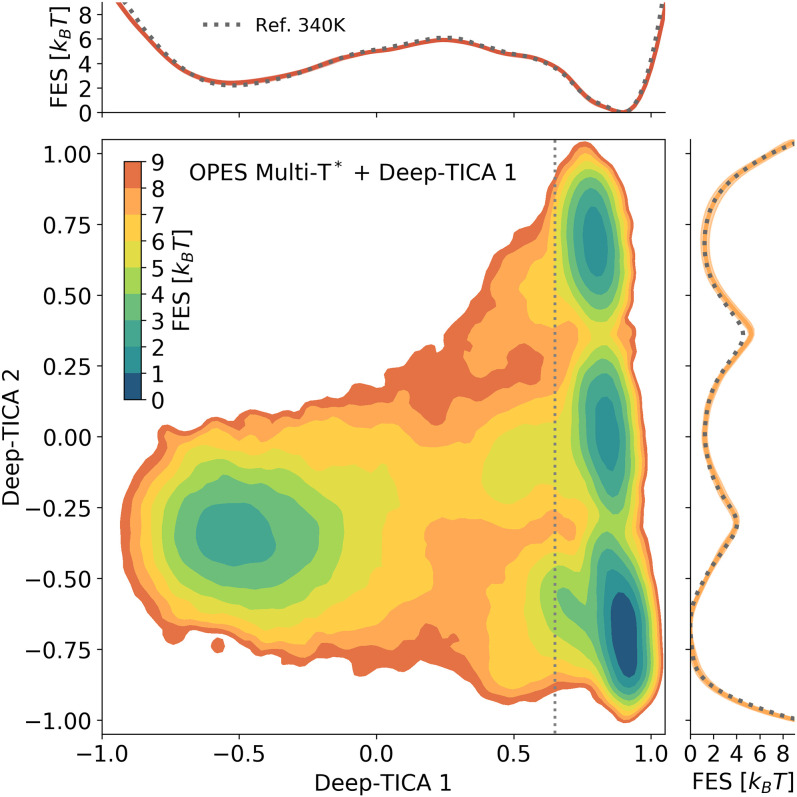
Fig. 5.
FES of chignolin at T = 340 K as a function of the two leading Deep-TICA CVs. In Upper and Lower Right are shown the projections of the FES along the corresponding axis (solid lines), confronted with the reference value obtained from a long unbiased MD trajectory at 340 K (50) (dotted lines). Note that the projection of Deep-TICA 2 is obtained by integrating only the region of space with Deep-TICA 1 > 0.65 (marked by a dotted line in Lower Left) to highlight the barriers between the folded metastable states.

