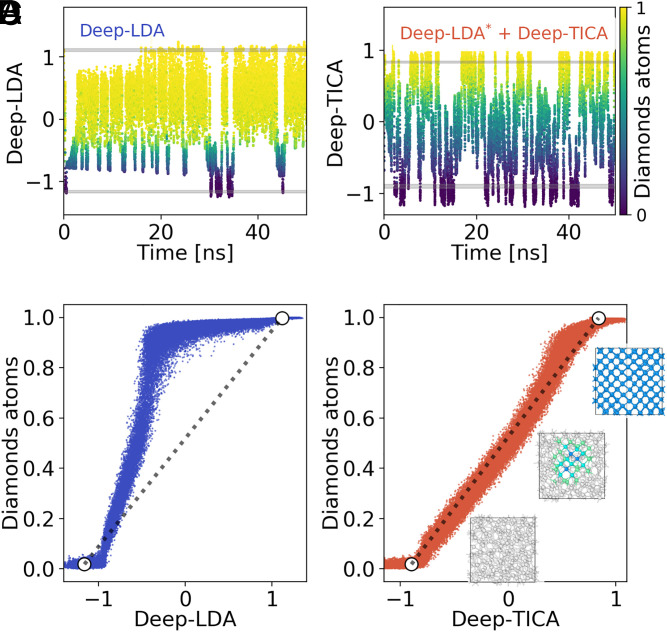
Fig. 6.
Comparison between (A and C) a Deep-LDA–driven simulation and (B and D) the one based on the present Deep-TICA approach. In A and B, we report the time evolution of (A) the Deep-LDA CV in the initial simulation and (B) the Deep-TICA CV in the improved one. In A and B, the points are colored according to the fraction of diamond-like atoms in the system, computed as in ref. 70. Gray shaded lines indicate the values of the two CVs in unbiased simulations of the liquid (bottom lines) and solid (top lines). C and D report the correlation between the two data-driven CVs and the fraction of diamond-like atoms. White circles denote the mean values of the two CVs in the liquid and solid states, while the dotted gray line interpolates between them. In D, we report also a few snapshots of the crystallization process made with the Open Visualization Tool (OVITO) software (71).

