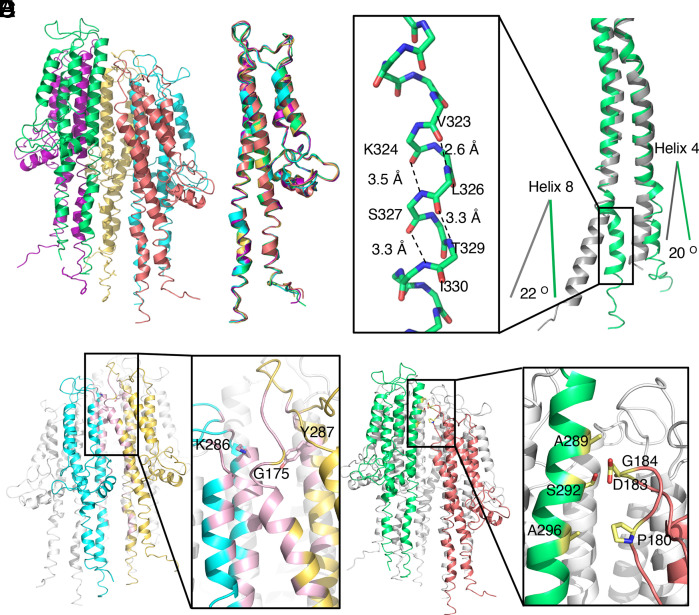
Fig. 2.
Atomic model of the tip complex. (A) Atomic model of the SipD pentamer. Each SipD subunit is colored following the same color scheme used in Fig. 1. (B) Structural alignment of the five SipD subunits. (C) Structural differences between SipD in the tip complex (green) and the crystal structure of monomeric SipD (gray) (PDB ID: 3NZZ). Shown in the Inset is a 310 helix that is present in SipD in the tip complex but absent in the monomeric structure. Hydrogen bonds are denoted as dashed lines. The differences between the orientations of residues 136 to 146 of helix 4 and residues 318 to 340 of helix 8 in the complex and monomeric structures of SipD are shown. (D) Common intersubunit interface in the SipD tip complex. Two of the SipD subunits in the complex are colored in yellow and cyan and the other three are colored in white. The interface between the two neighboring SipD subunits is highlighted in pink. The Inset shows a detail of the interface indicating the relevant residues involved. (E) SipD1–SipD5 interface. SipD1 and SipD5 are colored in green and deep salmon, respectively. The interface, depicted in the Inset, is highlighted in yellow. Side chains of the interacting residues targeted for functional analysis are shown as a stick model.

