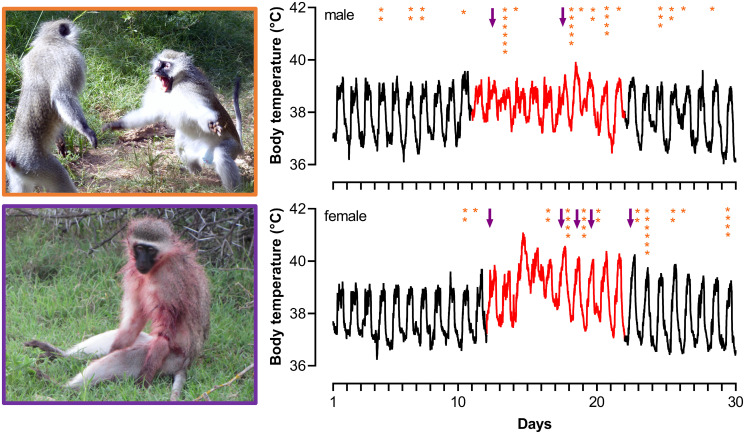
Fig. 2.
Illustration of the number of aggressions received (orange asterisks) and the timing of injury (purple arrows) across two fever periods (red lines). The data plotted represent 5-min recordings of body temperature from a single male (Upper Right) and female (Lower Right) vervet monkey. Photographs of male–male aggression (Upper Left, image credit: C. Young, NTU Psychology, Nottingham Trent University, Nottingham, UK) and an injured febrile male (Lower Left, image credit: R. Blersch, Department of Psychology, Lethbridge University, Lethbridge, AB, Canada).

