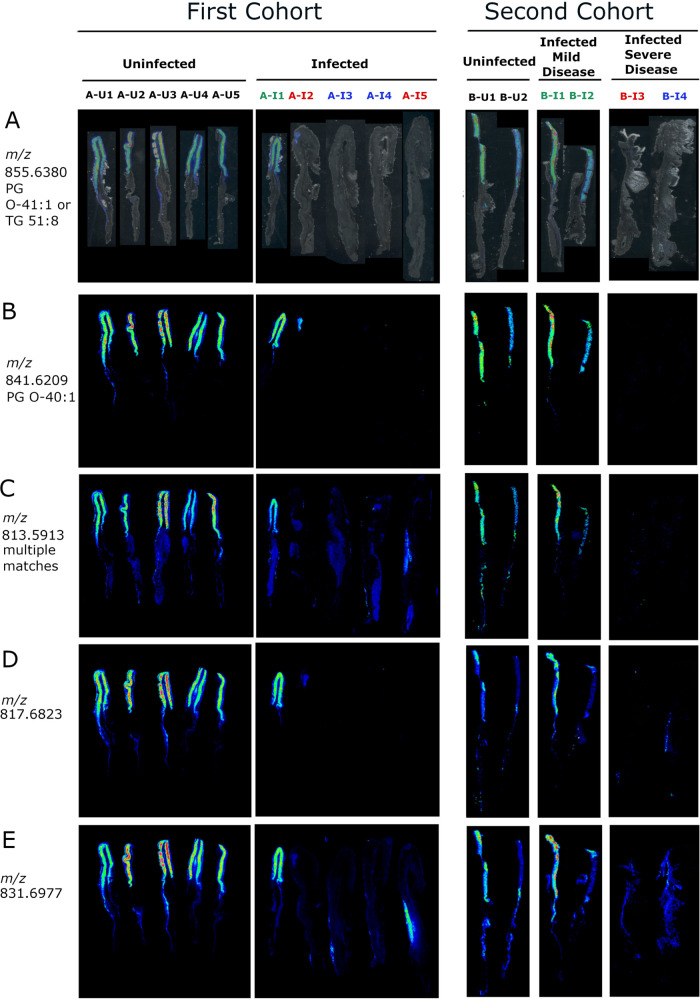
FIG 6.
IMS analysis showing corpus-specific localization of positive ions decreased in atrophic gastritis. (A) Overlay of ion 855.6380 on tissue optical sections for the first (left) and second (right) cohort of animals. (B to E) The respective ion images show corpus-specific localization of ions m/z 841.6209, 813.5913, 817.6823, and 831.6977 in the first (left) and second (right) set of tissues. Black font corresponds to uninfected animals with normal histology, green font indicates infected animals with mild disease (gastritis only), blue font indicates infected animals with dysplasia, and red font indicates infected animals with invasive gastric adenocarcinoma. The figure shows multiple tissue images joined together in an order different from that on the original slides.

