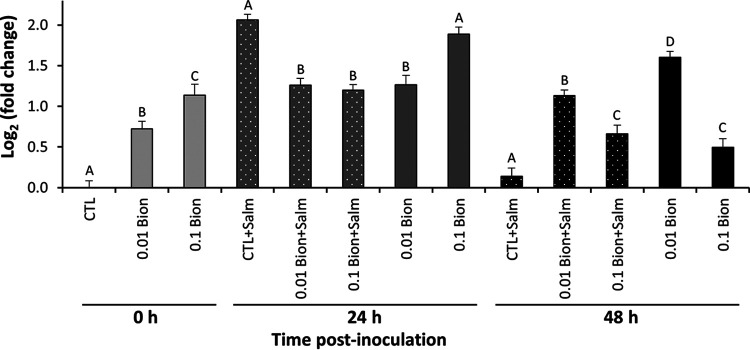
FIG 5.
Expression of the SAR marker PR1 in leaves of lettuce plants pretreated with 0.01 or 0.1% Bion, or H2O (control), as a root drench 24 h before vacuum infiltration with S. Typhimurium or with H2O (0 h). PR1 expression at 24 h and 48 h is shown as log2-fold change compared to that in leaves of mock-inoculated control (H2O-treated) plants at 0 h. Expression in inoculated leaves is denoted by +Salm. Solid bars, plants treated with Bion or H2O but noninoculated. Solid bars with dots, plants treated with Bion or H2O and inoculated with S. Typhimurium. Data represent the means for three replicate leaves sampled from three replicate pots, as well as the SEM. Different letters above bars illustrate significant difference within each sampling time as determined by Tukey’s multiple-comparison test (P < 0.05).

