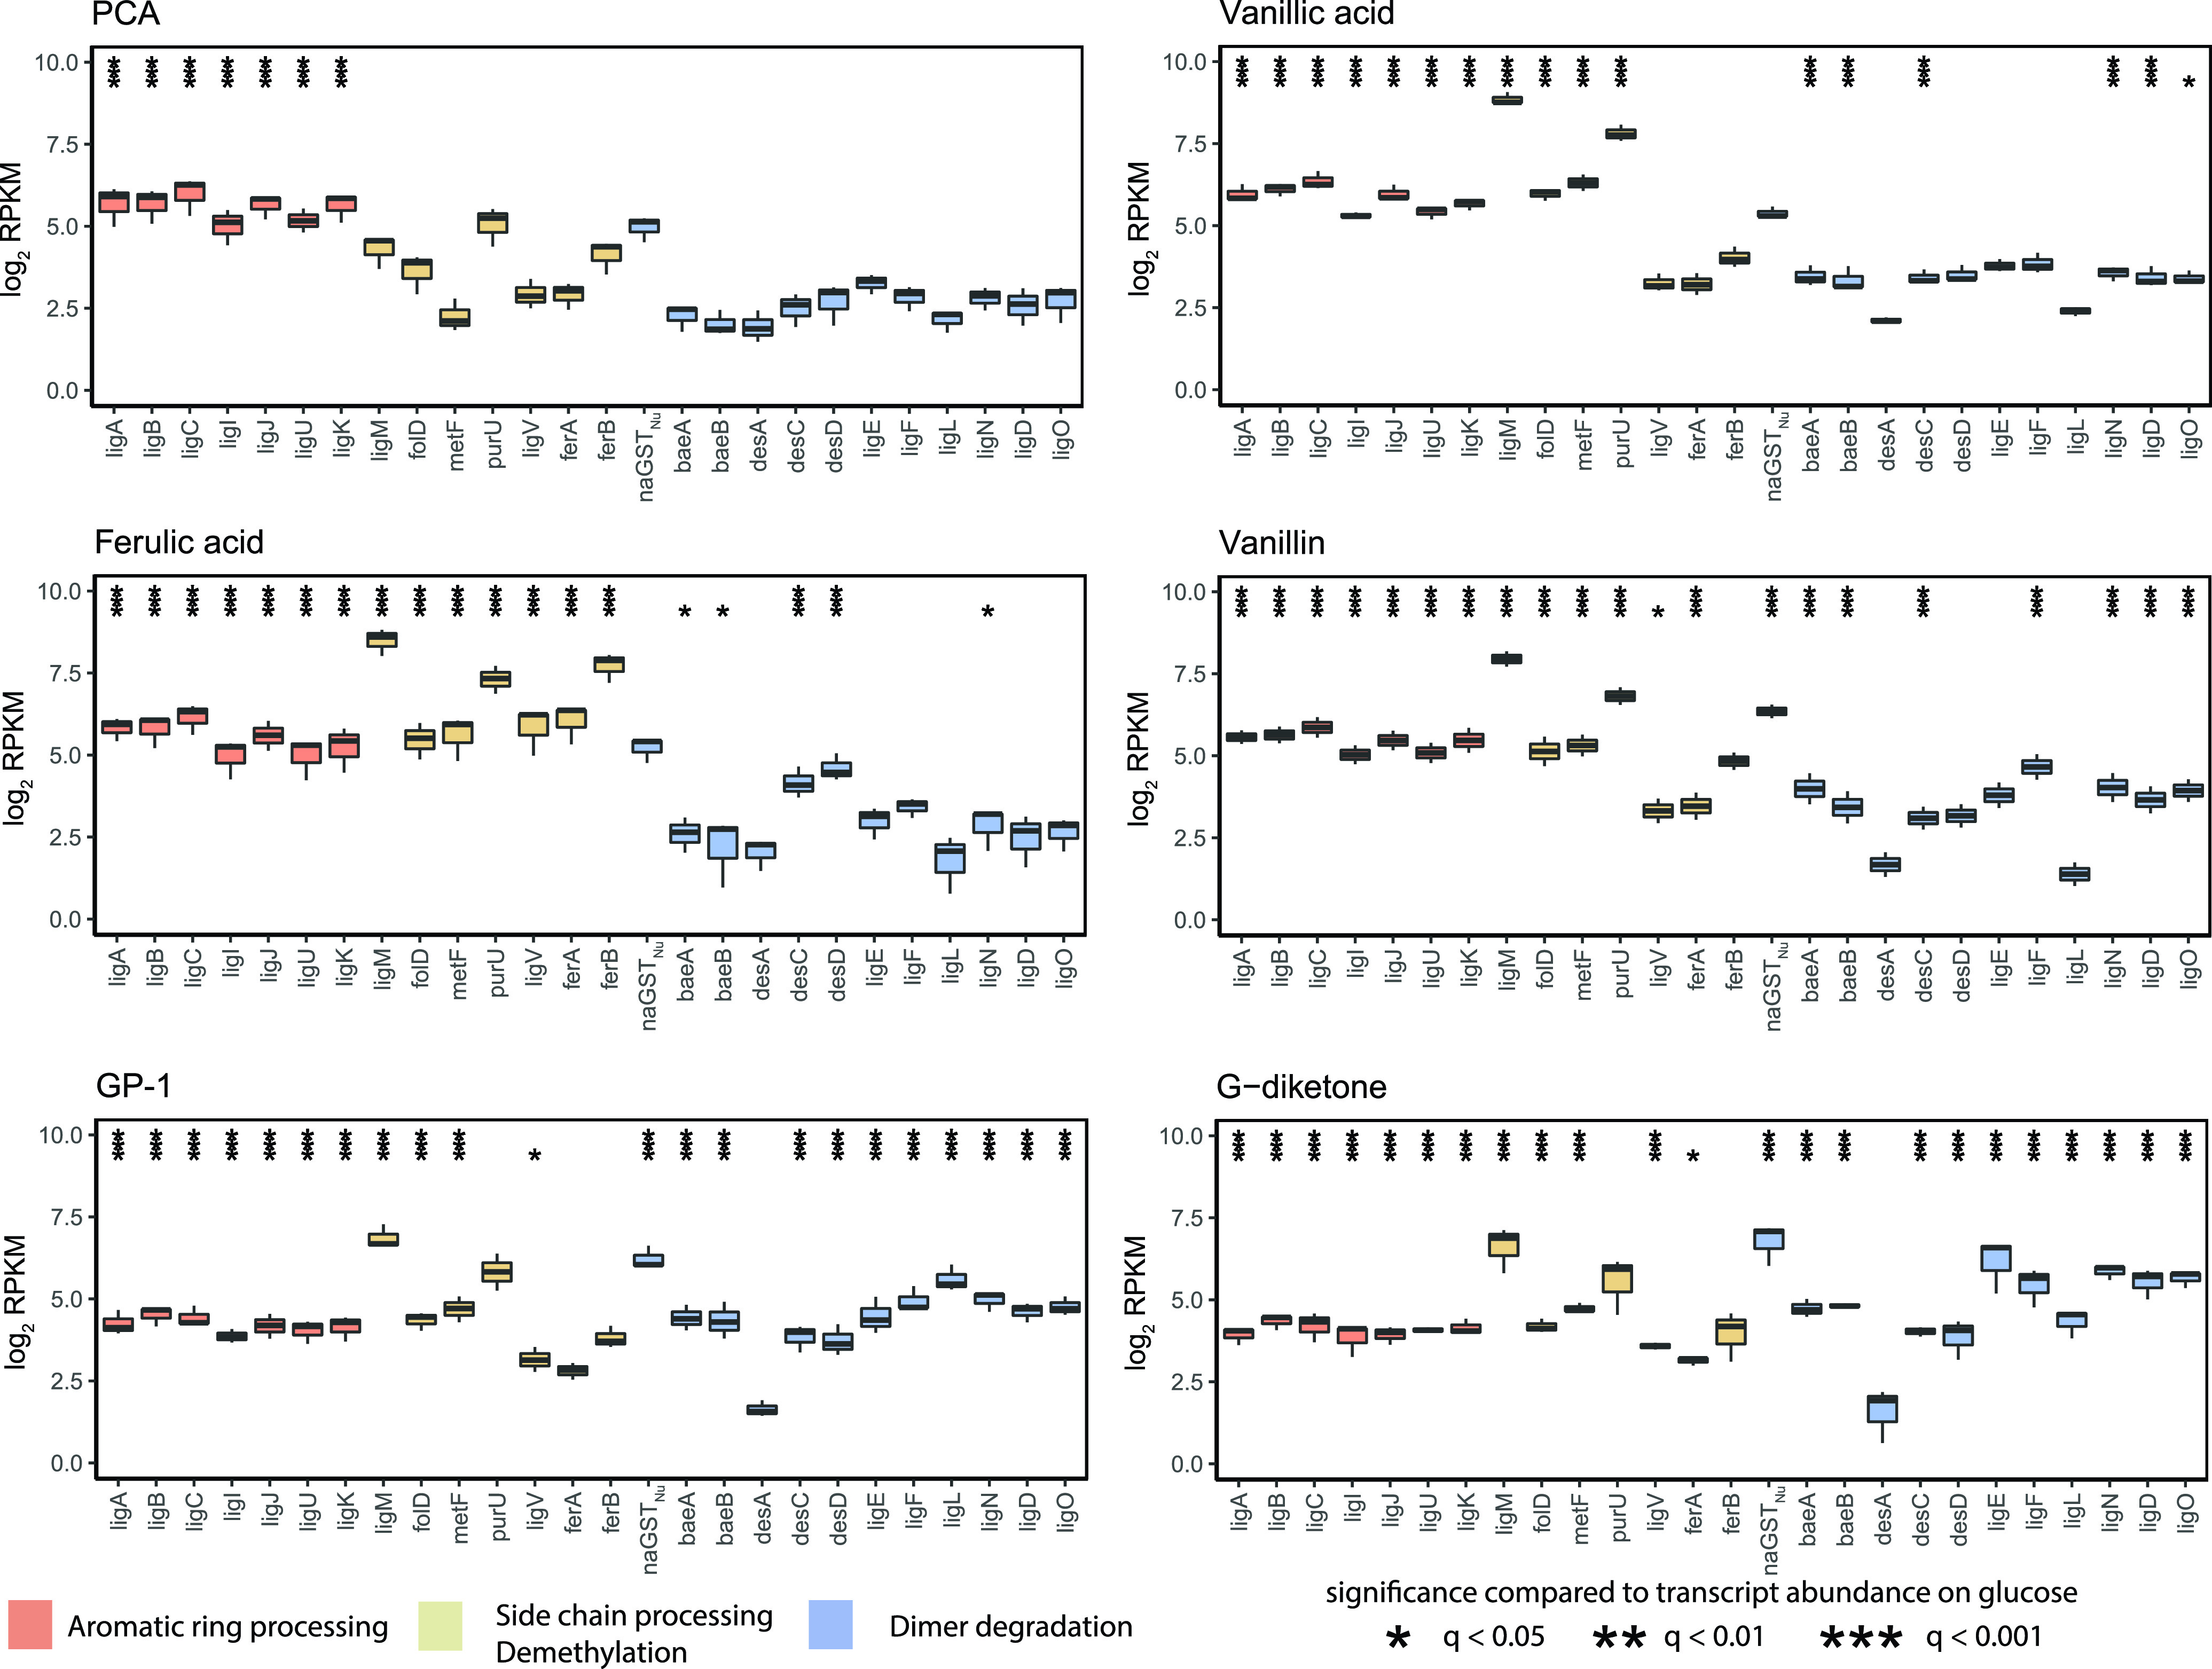
FIG 2.

Changes in transcript abundance for indicated genes when cells are grown in the presence of G-type aromatics. Each plot displays the log2 fold change in reads per kilobase million (RPKM) compared with glucose-grown N. aromaticivorans cells showing genes identified as encoding enzymes involved in aromatic metabolism. Black stars above a transcript with a significant change in levels (*q < 0.05, **q < 0.01, ***q < 0.001) compared with cells grown in the presence of glucose alone. Bars in each panel are colored to denote steps in aromatic metabolism that gene products are known to function (dimer degradation, aromatic ring processing, side chain processing/demethylation).
