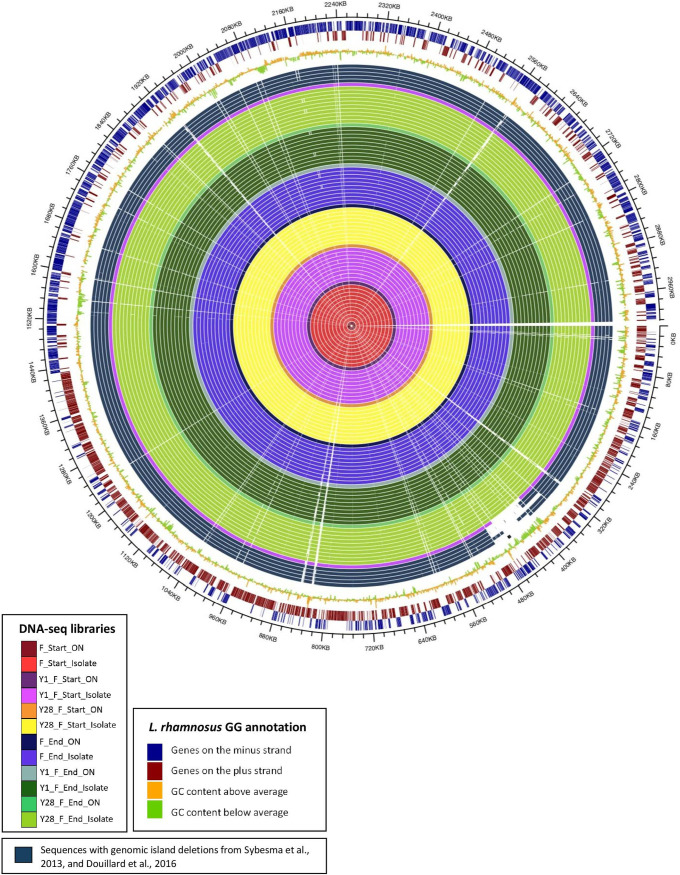
FIG 3.
Circular representation of alignments of DNA sequence contigs derived from the 66 samples sequenced. Each circle indicates the sequence from one sample, color-coded as defined in the key. For comparison, contigs from five sequences with gene deletions reported previously by Sybesma et al. (17) and Douillard et al. (14) are included. The three outer circles represent GC content and annotated genes on both strands, as indicated in the key.

