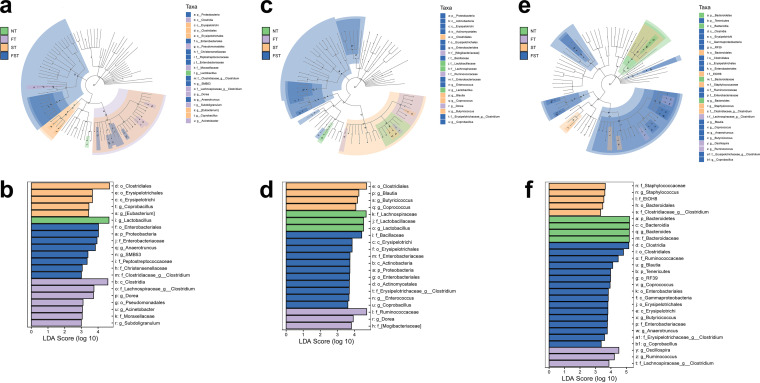
FIG 5.
Differences in the gut microbiota of the chicken cecum microbial community determined using the LEfSe analytic method. (a, c, and e) LEfSe plots (P < 0.05; log LDA score of >3) showing microbial strains with significant differences among the four treatment groups at 3 dpi (a), 10 dpi (c), and 17 dpi (e). The different groups are represented by different colors, the microbiota members that play an important role are represented by nodes of corresponding colors, and the organism markers are represented by colored circles. From inside to outside, the circles are ordered by species at the levels of phylum, class, order, family, and genus. (b, d, and f) LDA diagrams at three sampling points. Biomarkers with statistical differences are emphasized, with colors of the histograms representing the respective groups and the lengths representing LDA scores, which represent the magnitude of the effects of significantly different species between groups.

